
| You are in: Instruments > MIR > Data Reduction |  |
 |
Mid-IR Spectroscopy Reduction |
A normal set of spectroscopic observations includes the following:
The flat and bias observations are optional; they are taken for all Michelle spectroscopy, but are not done for T-ReCS spectroscopy. For a point source it turns out that the flat and bias correction does not appear to make a big difference in the output spectrum. It is likely to be more important for an extended source.
The calibration object will either be a star or an asteroid. Asteroids are needed as calibration targets at high spectral resolution because (unlike many stars) they are bright and have featureless spectra, allowing the removal of telluric features. For low resolution N-band or Q-band spectra stars are more often used as calibration sources, since they also allow approximate absolute flux calibration if their spectral energy distribution is known (see here for more information on selecting good telluric standard objects).
A difference between the higher resolution spectral modes of Michelle
and the low resolution modes (and all T-ReCS spectroscopy) is that the
higher resolution Michelle observations are carried out without chopping,
but only using nodding along the slit to subtract the atmospheric background,
as is the case for near-infrared observations. T-ReCS spectroscopy and the
low resolution Michelle N-band or Q-band spectroscopy are carried out
with chopping and nodding.
The Reduction Process
Several steps are needed in the reduction. All of these steps are included in the msreduce task in the midir package. The parameters of this task include many flags (the fl_ parameters) for either turning these steps on or off, where they are optional, or for whether the steps are done automatically or not. It turns out that a few of the steps either have to be done interactively or need "supervision" in case the automatic algorithms fail.
The msreduce task can be used in two ways. One can extract individual spectra without carrying out telluric corrections, if the fl_standard flag is "no". This produces a wavelength calibrated raw spectrum. Or one can extract the object and calibration spectra together and produce a wavelength calibrated and flux calibrated output spectrum, if the fl_standard flag is "yes". The flux calibration can be either absolute or relative depending upon the options chosen.
The only required parameter is the name of the raw data file for the object. If one is only extracting the raw spectrum without doing the telluric correction and calibration then no standard spectrum file needs to be specified. More usually one needs to give the name of the raw data file for the calibration standard (instd), set fl_standard to "yes". There are then two possibilities for how the calibration is carried out. If one sets the fl_blackbody flag to "yes" and specifies a temperature via the bbody parameter then the spectral shape of the calibration object will be assumed to follow that of a blackbody at the specified temperature. The alternative is to use a standard which has a known spectrophotometric energy distribution for the telluric correction, in which case along with correction for atmospheric effects an absolute flux level can be determined. If absolute calibration is to be carried out the name of the standard must be given in the stdname field. The spectrophotometric information for the TIMMI2 standards and for the large set of Cohen standards is available within the midir package. There are still two uncertainties about this type of absolute calibration: first the slit losses must be assumed to be the same for the standard as for the science target. Second, the calibration may be poor if the airmass match between the science target and the standard is not good enough, or if atmospheric conditions have changed during the observations.
In addition to these "operational" uncertainties, there is an "intrinsic" uncertainty in the use of the Cohen standards, which is that many of the stars do not have detailed photometric and spectroscopic observations in the mid-infrared, so the quality of any individual spectral template is generally not known. The number of very well characterized standards (i.e. alpha CMa, alpha Lyr, alpha Boo, and the other primary and secondary standards in the Cohen system) is small and these are not always accessible from either Gemini North or Gemini South. Hence these tertiary standards generally provide the only possibility of an absolute spectral calibration at these wavelengths.
In the blackbody case the resulting spectrum is of arbitrary intensity scaling, normalized to 1 at a specific wavelength (11 microns for the low resolution N-band spectrum case). In the case of absolute calibration the units of the output spectrum are determined by the outtype parameter. The default is to get frequency flux density in Jy in the output spectrum.
The outline of the steps in msreduce is as follows, where in parentheses the associated flag parameters of the task are listed:
These steps are discussed in detail in the following sections, and
also in this worked Michelle Q band
example.
Flat Fielding
To produce a flat: In spectroscopic mode flats are produced by taking spectra of either (a) the instrument cover of the primary mirror (in 2005B) or of a surface inside Michelle's calibration unit (starting in 2006A). These observations are taken in stare mode, along with a bias frame, and the files have only one extension which contains the flat or bias image. The raw "flat" frame is actually very nearly a blackbody spectrum at the ambient temperature of the dome/instrument when the observation was taken. If the fl_flat flag is set then the names of the raw data files for the flat-field spectrum and the bias frame need to be defined as the flat and bias. The msflatcor task then takes these two files as input and creates a normalized flat, which is then applied to the science data by (1) subtracting the bias level off the raw images, and (2) dividing the resulting image by the normalized flat image. An "f" is prefixed to the original file name at this stage.
For spectra of point sources it appears that the flat fielding does not make an appreciable difference in the results. It is for extended sources where the flat fielding correction is potentially important, since the spectrum for the source and for the standard may come from very different parts of the array.
The flat fielding is applied to the raw data files, before any
stacking or differencing of the images is carried out.
The Initial Processing
This refers to the process of taking the raw (or flatfielded) data file, something like "N20060108S0120.fits", and carrying out the initial processing that is needed for all mid-IR observations. This involves using the mprepare/tprepare and mistack tasks. For spectroscopy in addition to stacking up the difference frames one also needs to stack up the source frames to make a sky spectrum image which is used for the wavelength calibration. Three output files result from this step: the "prepared" raw data file, prefixed with "m" or "t", the stacked difference file, prefixed with "r", and the stacked sky spectrum file, prefixed with "a".
Once the initial processing is done then this step need not be
re-done as long as the "a" and "r" files are present in the current
directory.
Line Identification
This step needs to be done interactively in most cases as the lines that are marked by the automatic process are usually wrong. The sky spectrum is used for this purpose since arc spectra cannot normally be taken in the N-band or in the Q-band. The nswavelength task in the gnirs package is used in this step, which in turn calls the identify task in the NOAO package.
There is a default line list file for low resolution N-band and Q-band spectroscopy in the "data" directory of the gnirs package. These "lines" are blends or band features in some cases. For example, the 9.503 micron peak of the ozone band can be used to calibrate lowN spectroscopy. At very high resolution, as with the Michelle echelle mode, many individual lines are seen, but at the moment there is no list of all of these lines.
The extent to which the lines/bands stand out from the general sky emission is a strong function of the conditions, especially the water vapour column along the line of sight, and also depends strongly on the slit width used. Below are shown a few examples of spectra at the line identification stage of msreduce. Initially one has to check the line IDs that are automatically done when the task starts, and then usually clear all the IDs with the "i" key and start again.
The following are the line wavelengths, in Angstroms, for the lines that are used with the low resolution spectroscopy modes:
74670 Sky
78750 Sky
85140 Sky
88020 Sky
95030 Sky
102600 Sky
117280 Sky
128770 Sky
175860 Sky
182980 Sky
186480 Sky
190150 Sky
193100 Sky
198900 Sky
203220 Sky
206530 Sky
211750 Sky
218550 Sky
225950 Sky
229410 Sky
231990 Sky
Now here are some screen shots:
(1) Narrow slit/dry conditions at Mauna Kea:
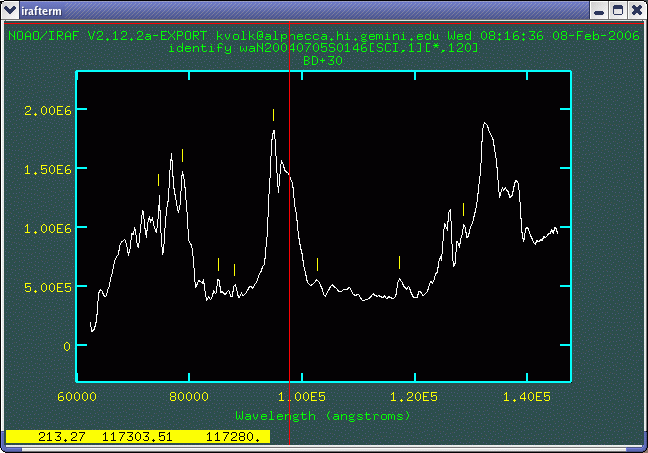
Using a narrow (2-pixel) slit increases the resolution and reduces the background level. In this case eight of the nine N-band "lines" are found automatically, which is enough to get a good solution. The marked lines are listed in the table below. The "wavelength" is the fitted wavelength value, while the "Line ID" column gives the nominal line wavelength. Both these values are in Angstroms.
   pixel    wavelength   Line ID
-----------------------------------
   47.78   74619.2101     74670.
   63.93   78813.4841     78750.
   88.50   85166.8354     85140.
   99.62    88033.285     88020.
  126.45   94941.4424     95030.
  156.33   102622.713    102600.
  213.27   117303.511    117280.
  257.31    128759.52    128770.
(2) Worse Mauna Kea conditions, and a wider slit:
With a wider slit the effective wavelength resolution is reduced, and in wetter conditions the contrast between the lines and continuum is reduced (note e.g. the marked difference in the ozone band). This makes finding the various "lines" much more difficult. These spectra were taken one after the other but one sees a difference in the number of "lines" that can be located.
This observation used the four pixel slit and was at lower airmass than the observation shown above.
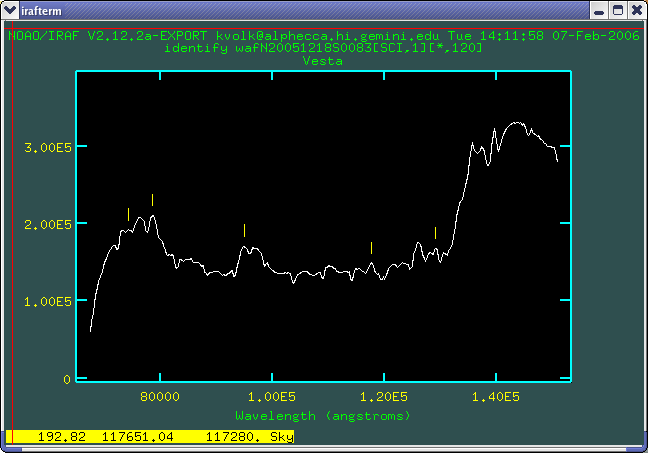
For this spectrum only five of the "lines" could be identified.
   pixel    wavelength   Line ID
-----------------------------------
     26.88 74568.0089     74670.
     43.82 78907.1222     78750.
    106.18  94944.751     95030.
    192.82 117330.486    117280.
    237.00 128749.632    128770.
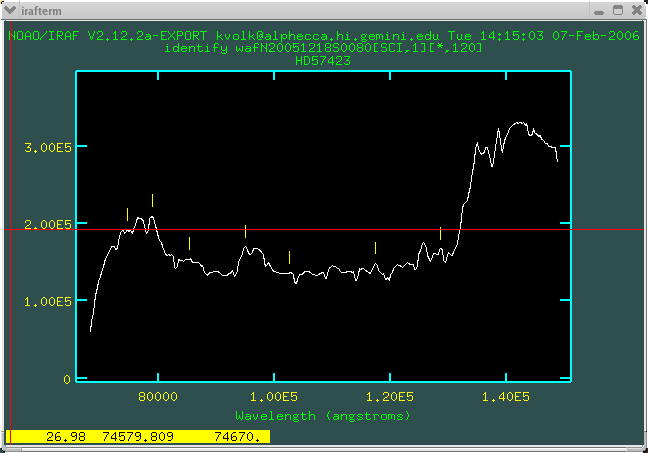
For this spectrum seven of the "lines" could be identified.
   pixel    wavelength   Line ID
-----------------------------------
     26.98  74579.809     74670.
     43.69 78800.4521     78750.
     69.21 85325.1787     85140.
    106.14 94888.4792     95030.
    135.37 102506.004    102600.
    192.75 117419.864    117280.
    237.03 128720.213    128770.
In general one just has to try to locate the "lines" and get a consistent wavelength solution with only small residuals. The 95030 Angstrom and 78750 Angstrom bands are always easily located, so in the worst case one can use these to define a linear wavelength scale. The 117280 Angstrom band is the next easiest feature to locate.
(3) Q-band spectroscopy:
In the Q-band the atmospheric bands are stronger than at N. The features chosen for the identification are all peaks of bands, and in the resulting raw extracted spectrum these peaks become minima. The only good thing about this is that all 13 features are always present in the spectra, exactly as listed above.
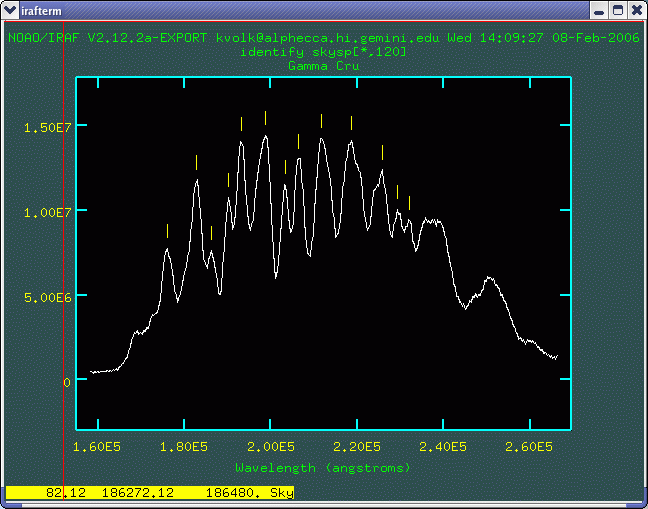

   pixel    wavelength   Line ID
-----------------------------------
    61.83   175780.171    175860.
    83.68   182971.936    182980.
    94.70   186596.989    186480.
   105.69   190216.019    190150.
   114.53   193123.953    193100.
   131.93   198851.61     198900.
   145.20   203220.359    203220.
   155.23   206521.998    206530.
   170.89   211676.384    211750.
   191.69   218524.299    218550.
   213.93   225844.891    225950.
   224.97   229478.821    229410.
   232.82   232062.571    231990.
At higher spectroscopic resolution the lines that can be identified are different than those listed above. However we do not have a definitive line list for every mode and wavelength range. In these cases, PIs may wish to work with their contact scientist to identify the atmospheric lines.
After the initial identification of lines the tasks then seek to
identify the same lines in spectral sections from other parts of the
sky spectrum, since the sky fills the slit from top to bottom. In
most cases this re-identification can be done automatically. There
are rare cases where the automatic re-identification fails and then it
must be re-done interactively. Once the lines have been identified
over the image, a transformation is calculated from pixel position to
wavelength. This is applied to the spectrum when it is extracted in
the next step.
Extracting the Raw Spectrum
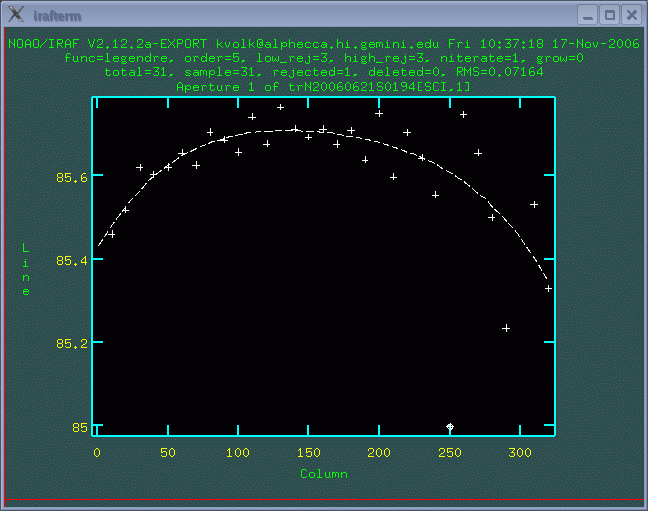
The next step is to extract the spectrum. This is done using the standard routines in the NOAO twodspec package, specifically the apall task. One first marks the region to be extracted from a cut across the difference spectrum, and then traces this across the dispersion direction. Normally for brighter objects this is routine.
One should normally set the fl_extract flag to "yes" in order to examine the tracing. Usually the points at the left and right ends of the spectrum are not reliable and should be removed from the tracing. Spectra from Michelle or T-ReCS do not change position very much over the detector (usually 1 pixel or so) and the tracing of the spectrum should be close to linear. If either of these things is not the case from the automatic tracing, points need to be excluded until a reasonable tracing is obtained. An example of a reasonable fit is shown below. Note the points that were deleted at left and at right.
The reason why the tracing is lost at left (short wavelengths) and at right (long wavelengths) is that there are strong water bands in these regions. Unless the conditions are exceptionally dry these regions, wavelengths of less than 7 microns or of more than 13 microns, suffer from too much absorption to be used at this low resolution.
Given that the aperture is 6 pixels wide a linear fit would have been just as good as the slightly curved fit that is shown here.
Defringing the Spectrum
Michelle and T-ReCS spectra are sometimes subject to fringing. At high resolution the fringing is nearly always present but for low resolution spectra the fringing may not be seen, depending on the slit width. The fringes can generally be identified via fourier analysis and removed. This is an interactive step in the reductions, if requested, because finding the correct filter in the fourier domain is not something that can be automated.
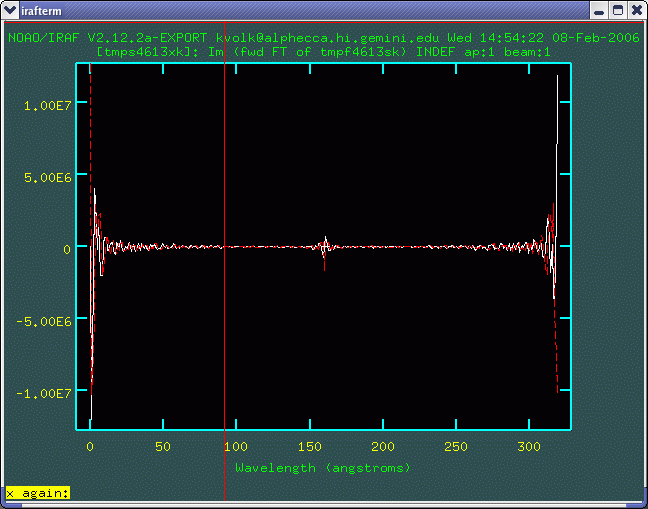
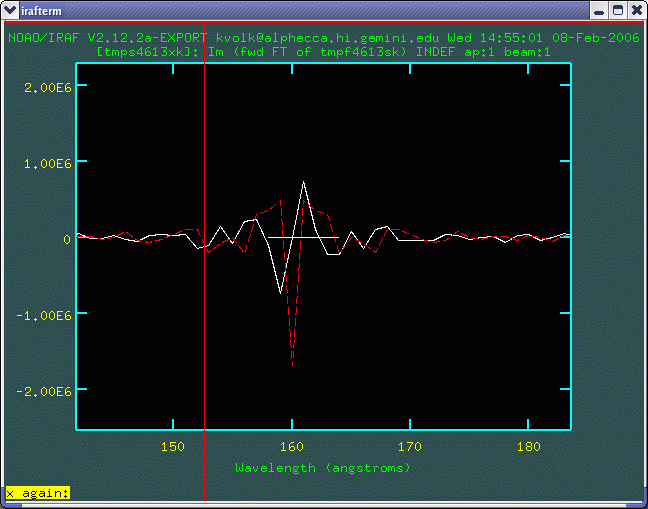
An example of a badly fringed T-ReCS spectrum is shown below. When the msdefringe task is called it carries out a fourier transform of the input spectrum and initially plots the real and imaginary parts as a function of frequency bin. For a low resolution spectrum only the highest frequency component needs to be removed. One has the option of setting the range of components that are to be removed, and these can either be set to zero or be replaced by an interpolated value from the end points. Another option that is available is to screen out all negative values to zero, This is not always a good idea. If all the "real" structure in the spectrum is positive then this works well, but if the baseline level is slightly offset to negative values due to a drift in the sky background during an observation then it will not work properly.
The following screen shots show the process of defringing a spectrum.
The original spectrum
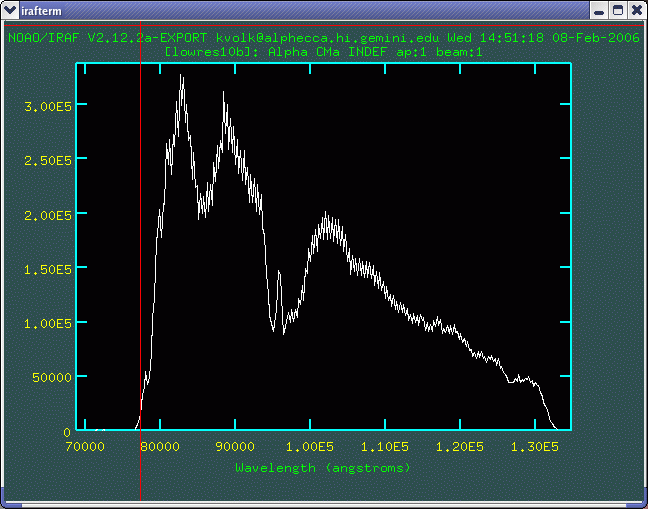
The fourier plot. The white curve is the real part, and the red curve is the imaginary part. One usually looks for the fringes in the real part.
A zoomed view of the high frequency part of the plot. The white line indicates the filtered values for the real and imaginary parts. In this case both are set to zero.
Once one exits from the fourier domain plot with the "q" key the next plot comes up: the original and defringed spectra. If the defringing has removed real structure, this is where one should reset with the "r" key or choose to exit without defringing using the "i" key.
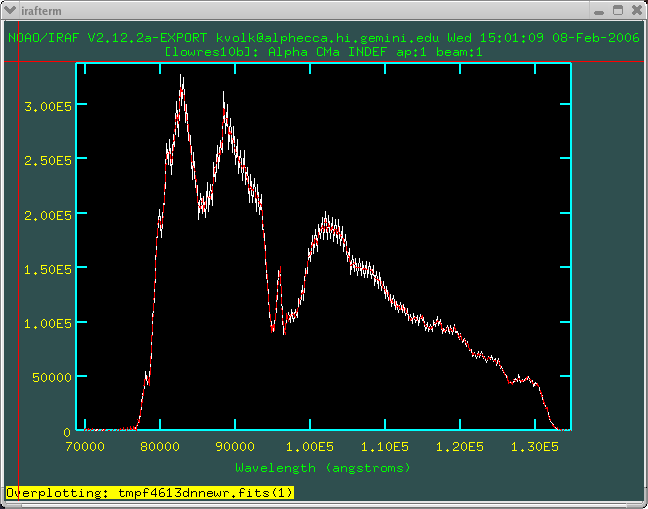
Here is the output defringed spectrum by itself.
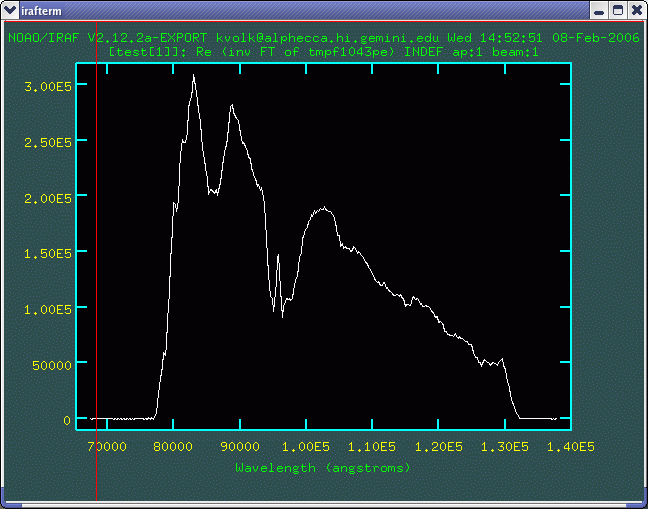
If the defringed spectrum has lost its baseline level the plot of the "before" and "after" spectra looks like this--
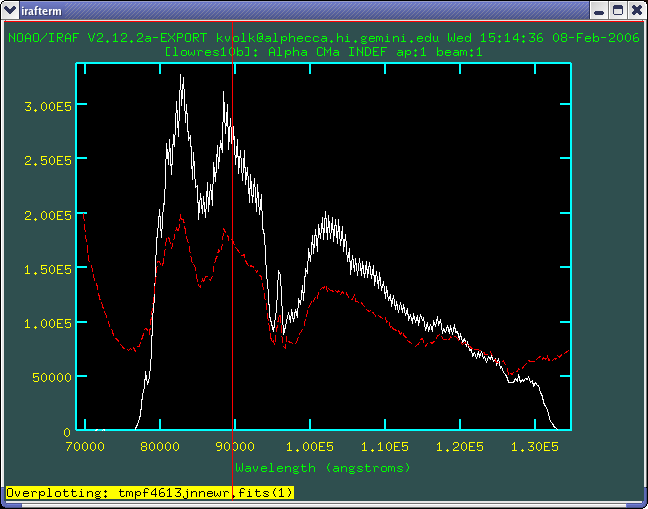
where the red curve is the "corrected" spectrum, but it does not have the
correct base level. This is the result of masking out negative values when
the baseline in the original spectrum is slightly negative. If such a
behavior is seen, the only option is to run msdefringe manually
outside of msreduce and then run the telluric correction/calibration
step afterward.
Calibrating the Spectrum
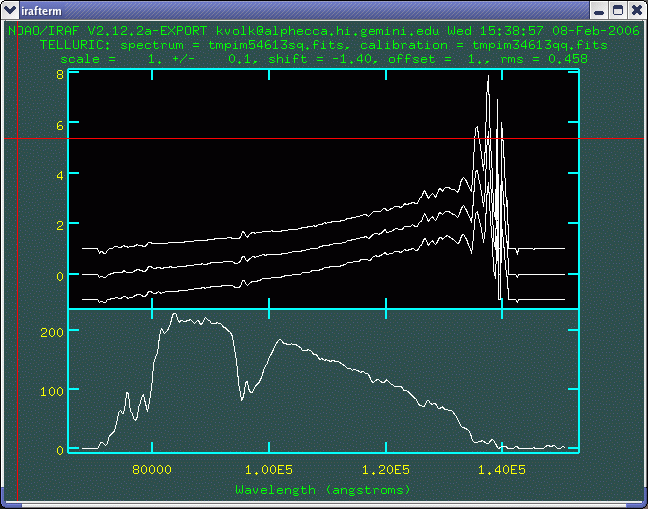
This step is done with the msabsflux task. It in turn calls the telluric task in the NOAO onedspec package. In most cases it is wise to carry out this step interactively, since the automatically found "best" spectrum often is not actually what is wanted, especially for low resolution spectra. This is typically due to having large regions of little or no signal in the source and calibration spectra. Noise in these regions produces absurdly large signals in the resultant spectrum which severely skew the chi-squared minimization used in telluric to find the optimum shift between the two spectra.
In view of this problem the first thing one should do in running the task interactively is to window the plot to exclude the long and short wavelength regions with little or no signal. Typically that is wavelengths longer than 13 microns and wavelengths shorter than 7.5 microns.
One way to proceed is to set :offset 0. and :dscale 0. so only one "output" spectrum is plotted in the upper panel. A scaling can usually be found that shows the proposed output spectrum fairly well. Then one needs to search the parameter space to get a good output spectrum.
It is generally best to change the shift value with the :shift command. It appears that the shifts are usually small, so starting at zero and then checking values slightly positive and negative from there is usually helpful. The main goal is to choose a shift that removes the ozone feature as well as possible. Wrong shifts cause the edges of the band to no longer match leaving a residual feature that tends to show up at around 9.3 to 9.6 microns.
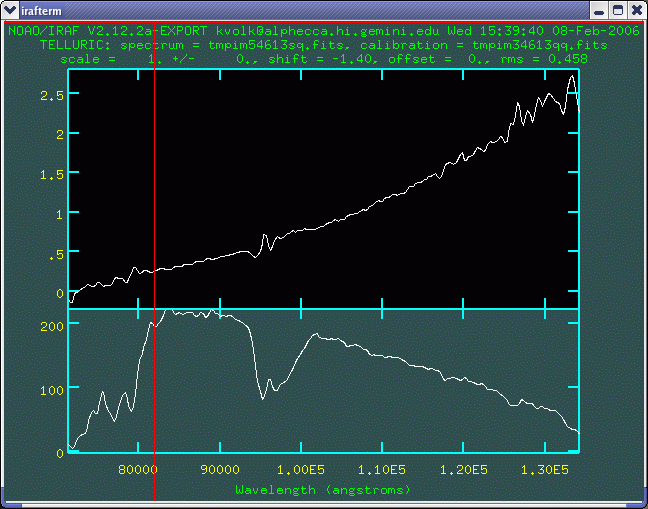
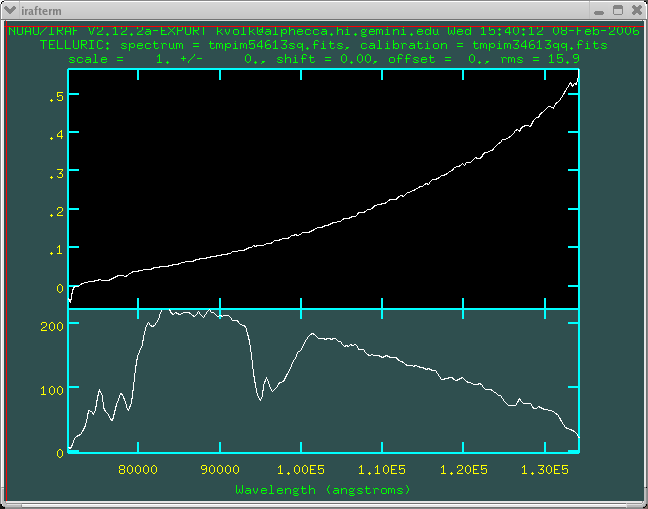
The following screen shots show the initial plot screen, the plot screen once the wavelength range has been restricted somewhat, and then the plot screen when the shift has been set to 0 pixels. In this case having no shift produces a nice, smooth output spectrum over the region seen in the plot. This is the spectrum of an asteroid so what is seen is something that is very close to a 217 K blackbody shape.
Initial plot, with the -1.40 pixel shift found by the telluric task:
After changing the range and setting offset, dscale to 0.0:
With a shift of 0.0 pixels:
If a simple shift is not enough to get rid of the ozone feature then one can try to change the scale value. This should be done with caution.
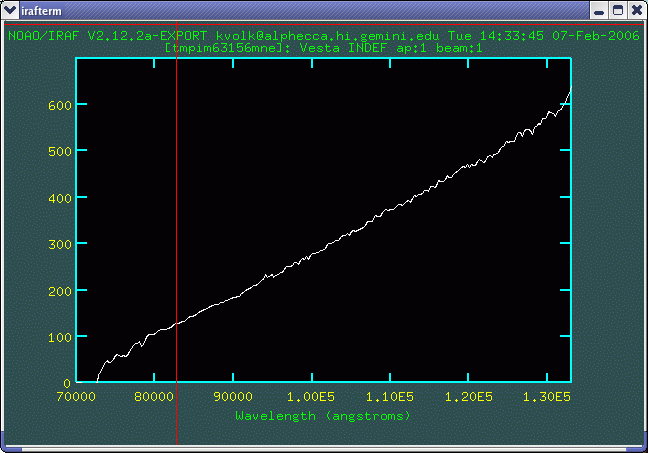
The final calibrated spectrum, with fluxes in Jy, is shown below. This spectrum of Vesta was taken near opposition; it rises steeply to longer wavelengths and is generally very bright over the entire N-band window.
Last update 2006 July 18; Rachel Mason, based on original pages by Kevin Volk.