International Gemini Observatory/NOIRLab/NSF/AURA
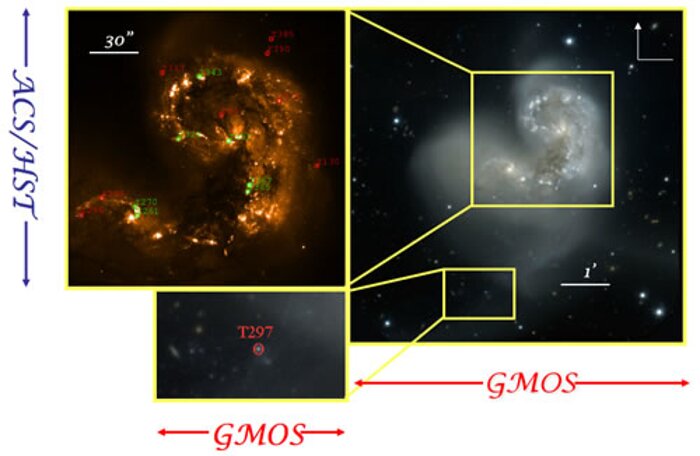
GMOS/HST ACS images of the main body and tidal tail of the Antennae
GMOS/HST ACS r', g' and B images of the main body and tidal tail of the Antennae, showing the locations of the observed clusters. Red represents clusters that display an absorption dominated spectrum, while green represents emission dominated spectra.