![[O III] intensity, narrow [O III] velocity map, and line-free continuum image](https://gemini.edu/common/media/archives/images/thumb700x/geminiann10006b.jpg)
International Gemini Observatory/NOIRLab/NSF/AURA
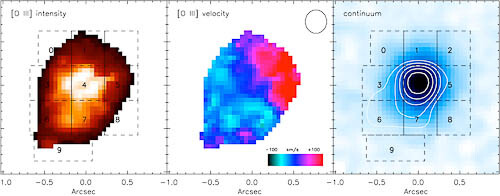
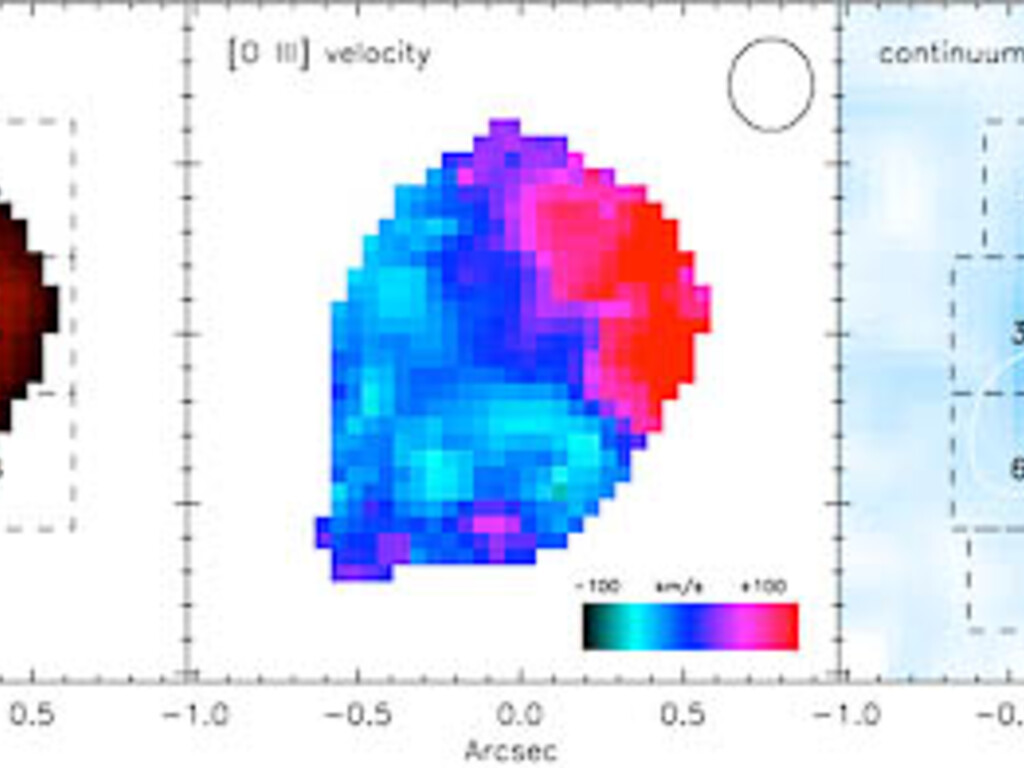
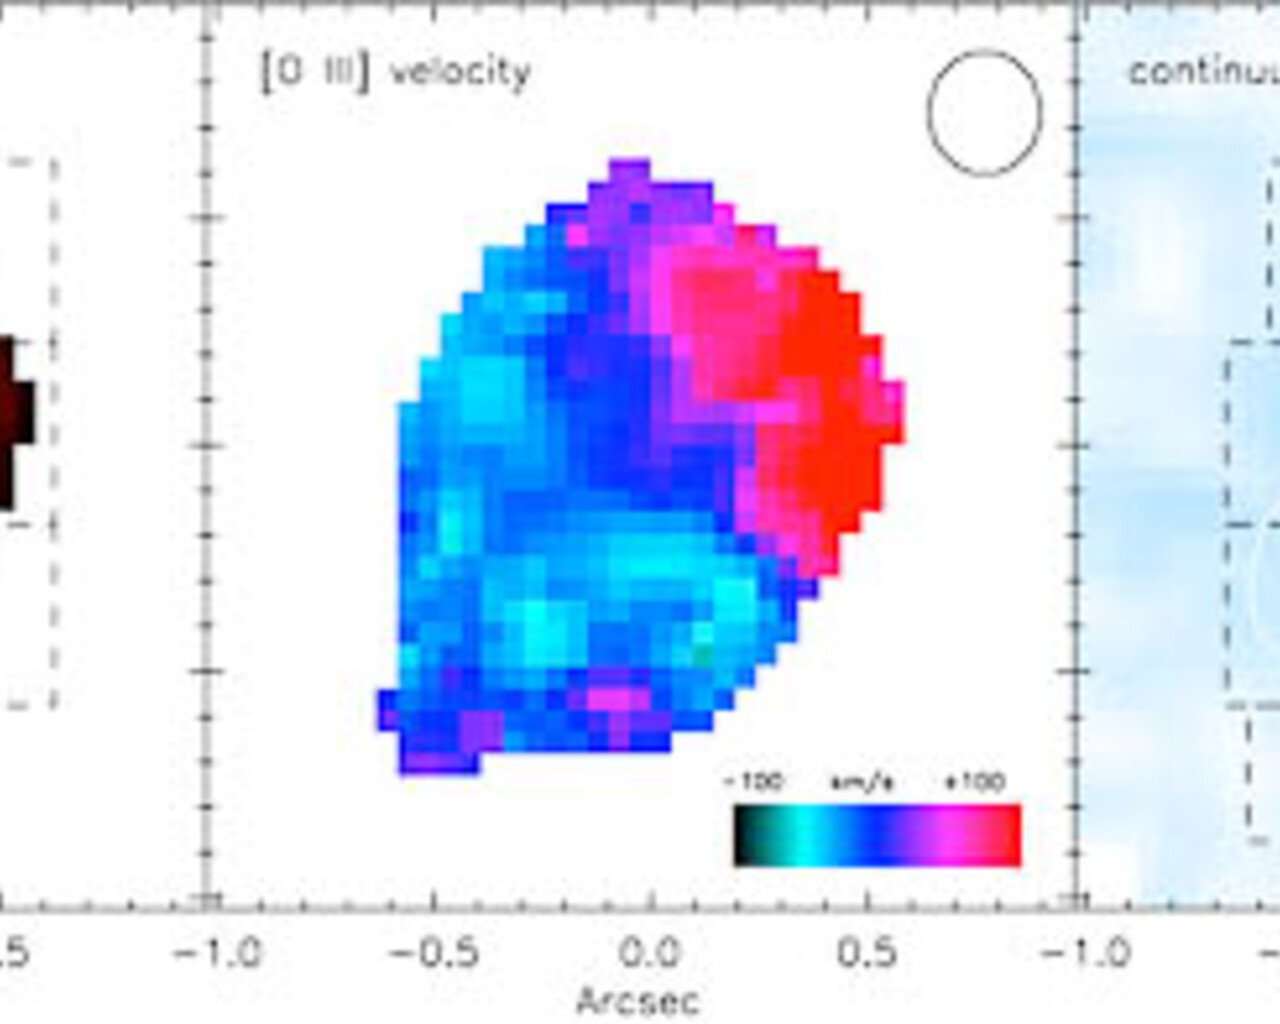
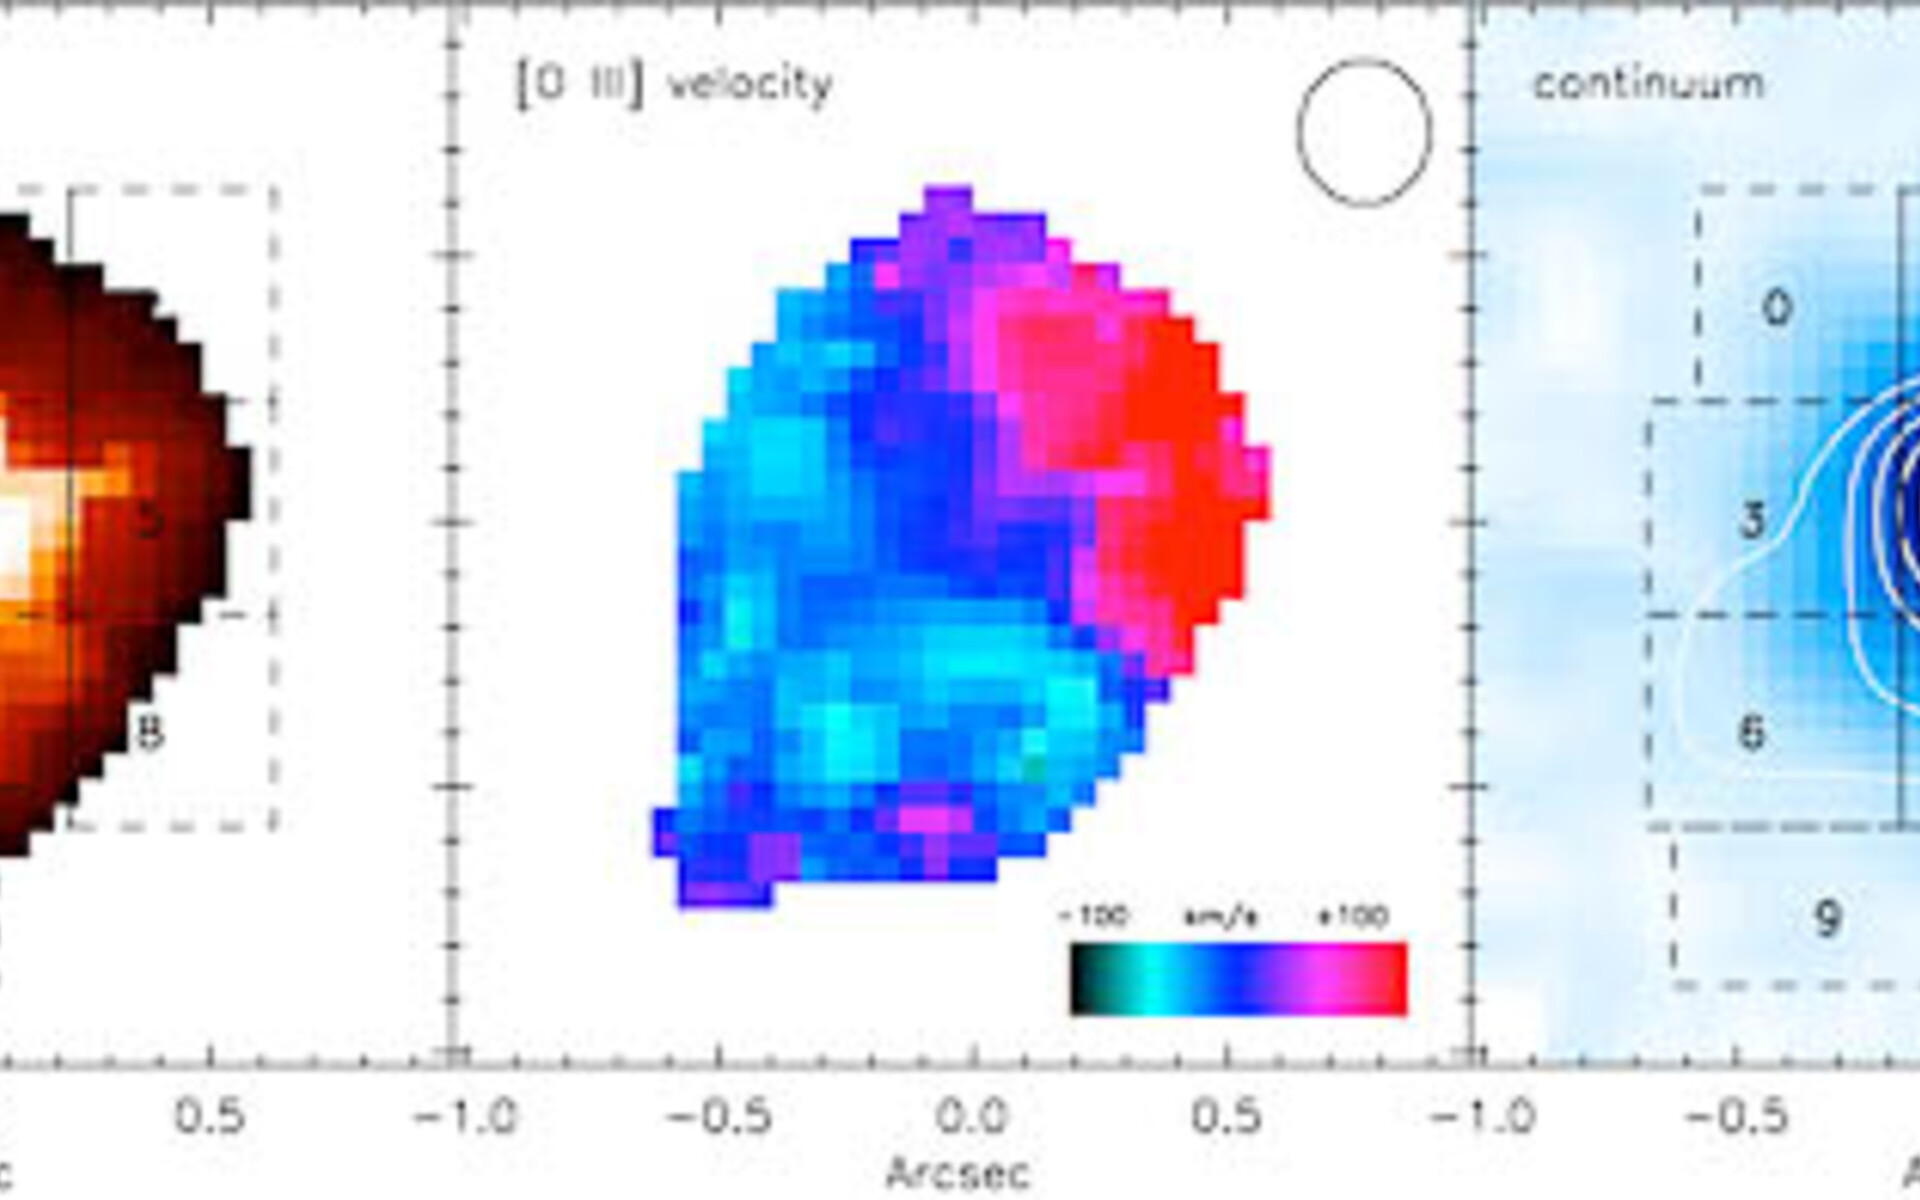
[O III] intensity, narrow [O III] velocity map, and line-free continuum image
[O III] intensity (left), narrow [O III] velocity map (middle), and line-free continuum image (right); circle in top right of velocity map denotes the seeing disk size. The contours represent an intensity weighted map of the broad [O III] emission components. The contour in the right panel traces the location and extent of the outflow at a scale of about 4-6 kiloparsecs. The numbered regions of the broad [O III] emission are plotted in geminiann10006c.