International Gemini Observatory/NOIRLab/NSF/AURA
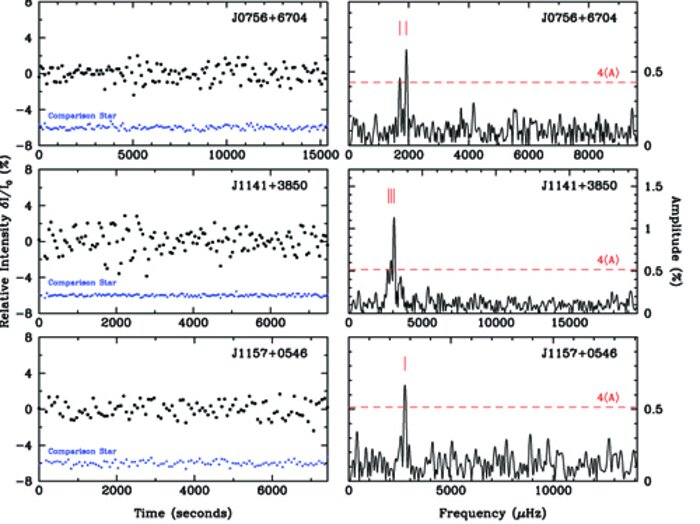
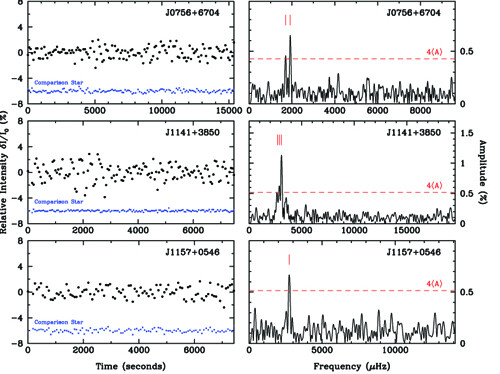
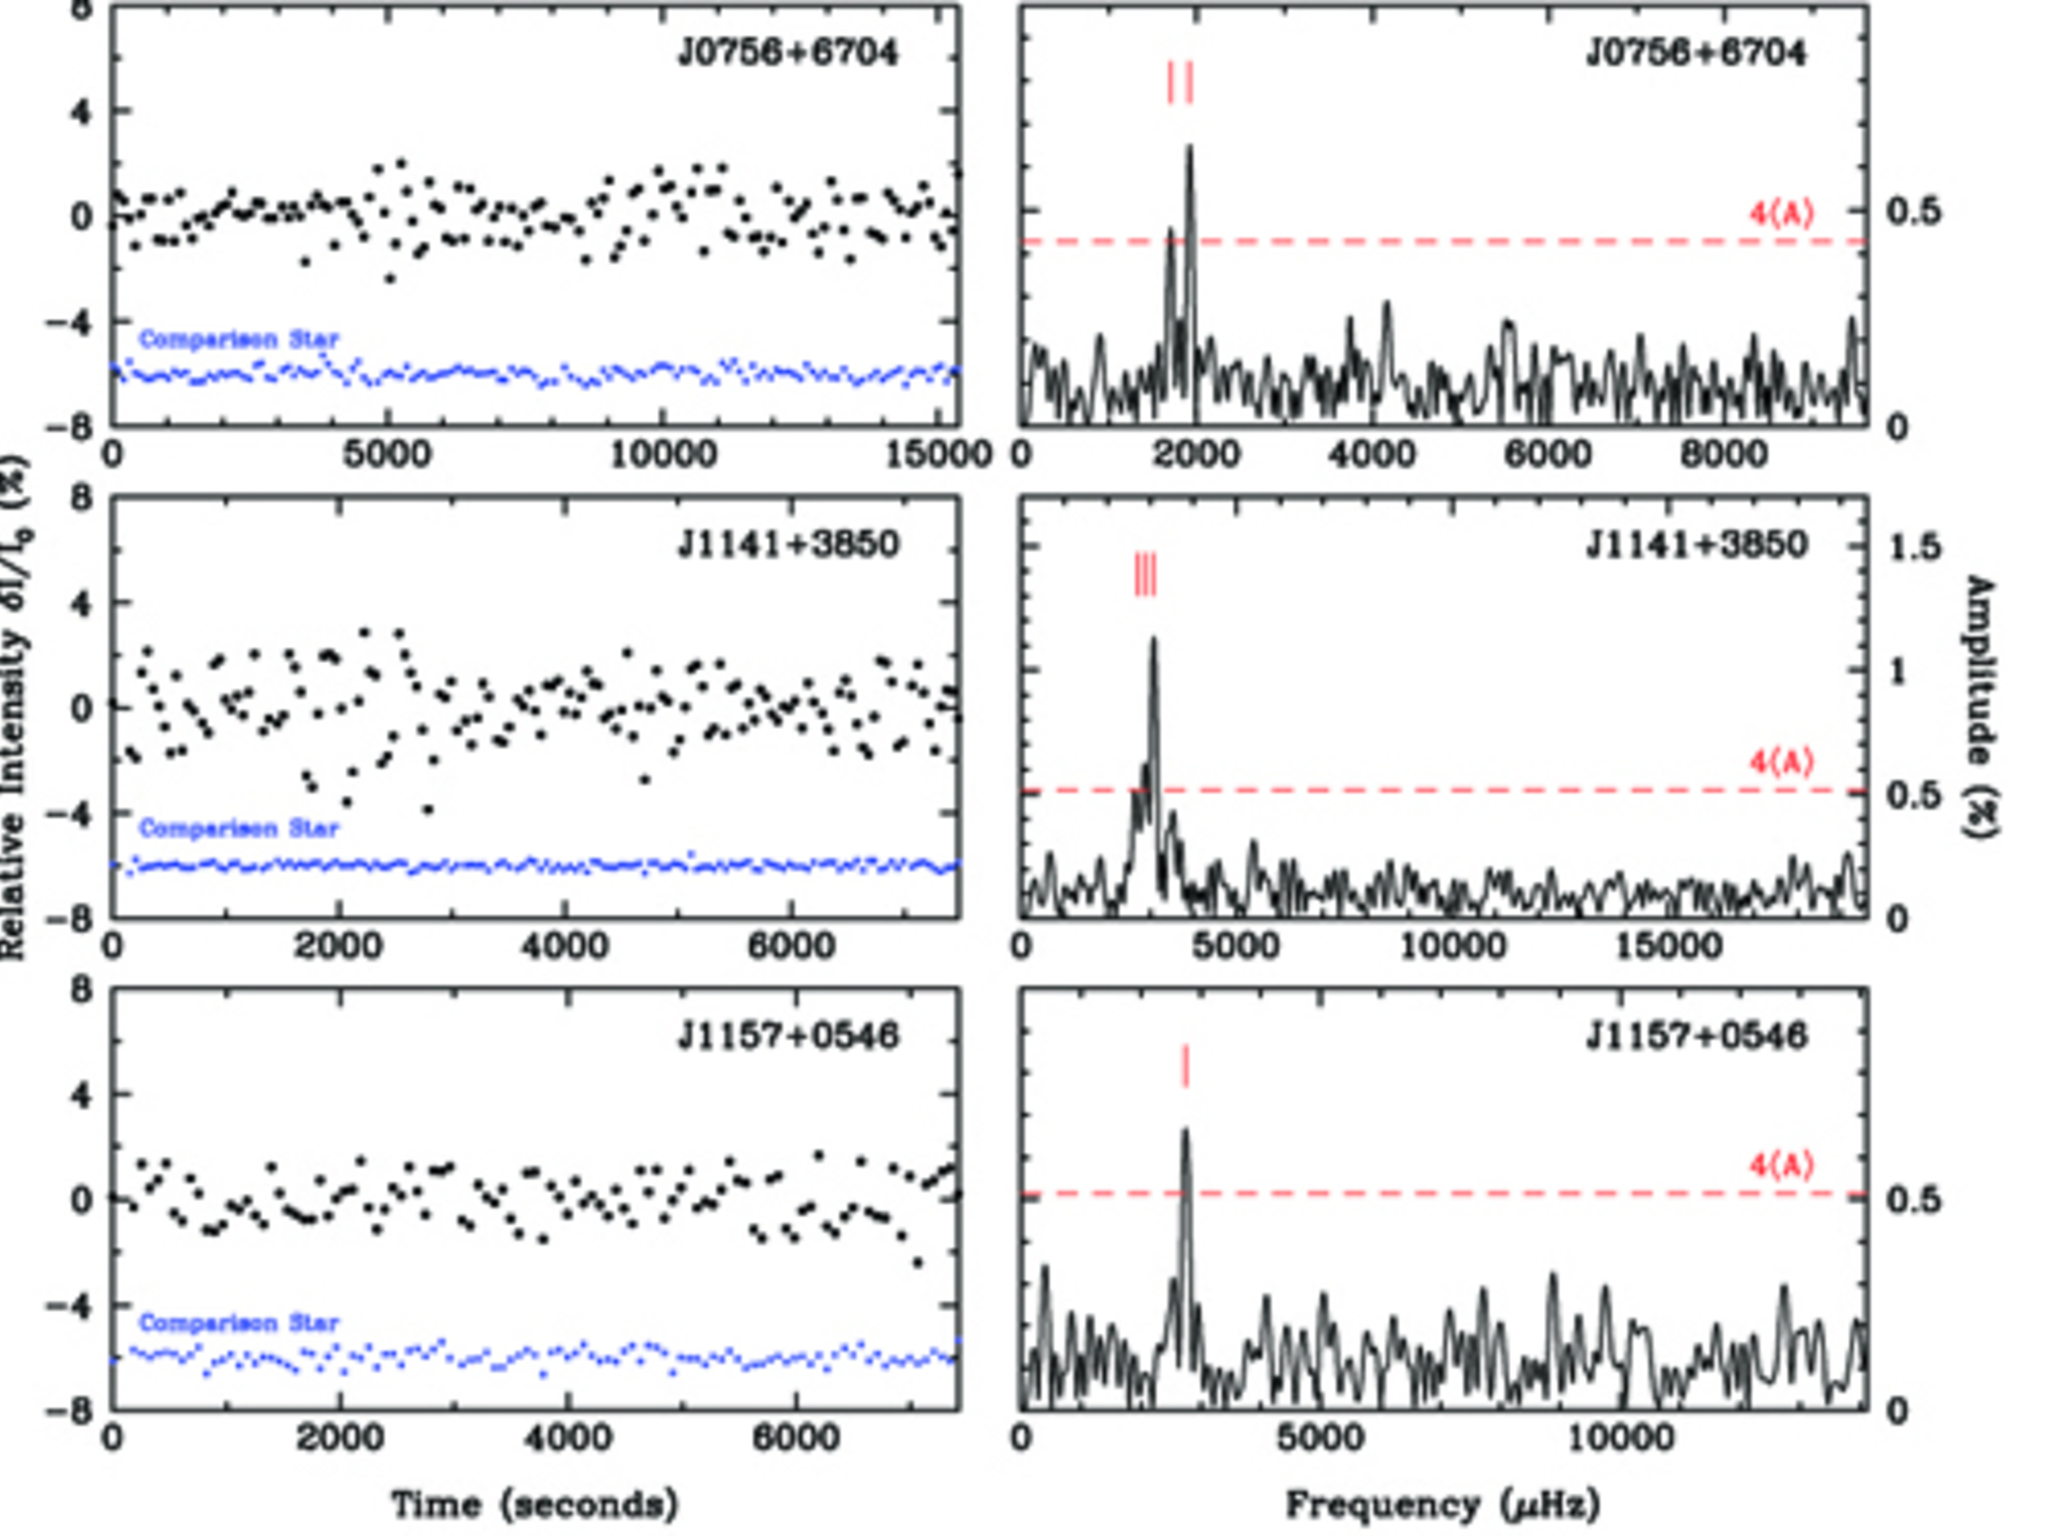
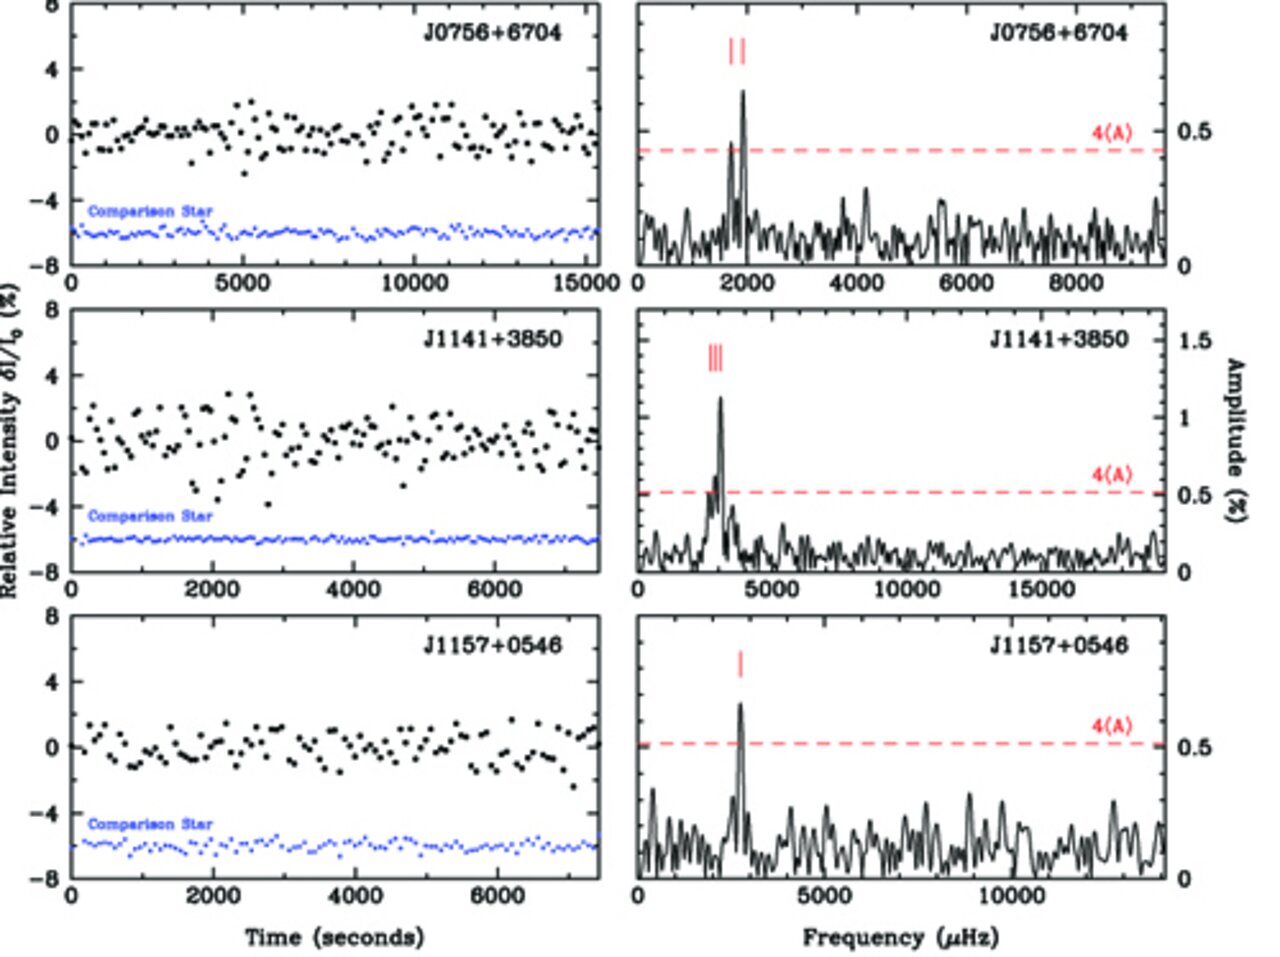
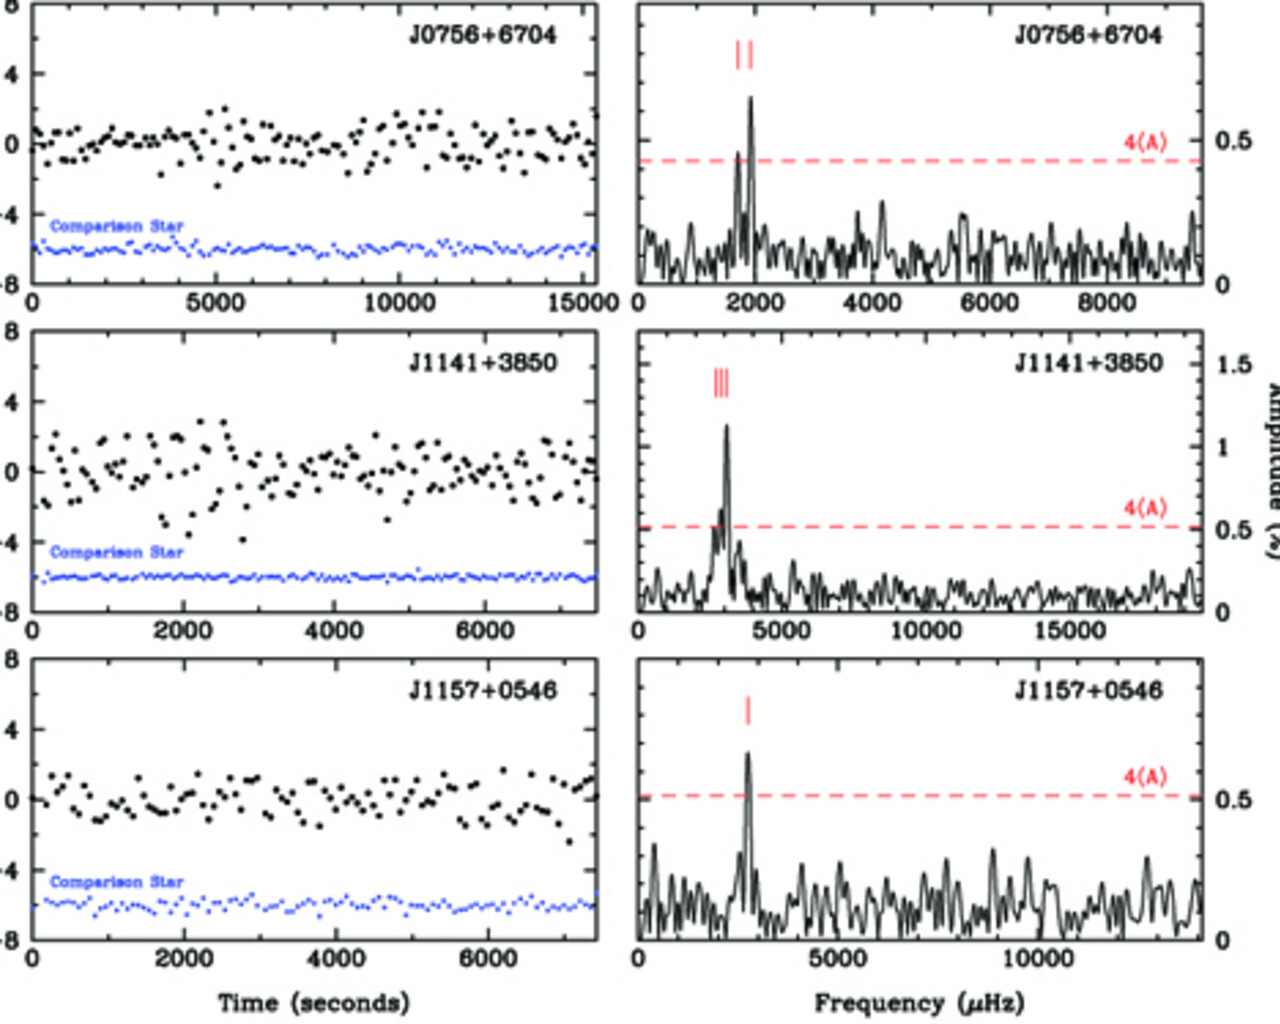
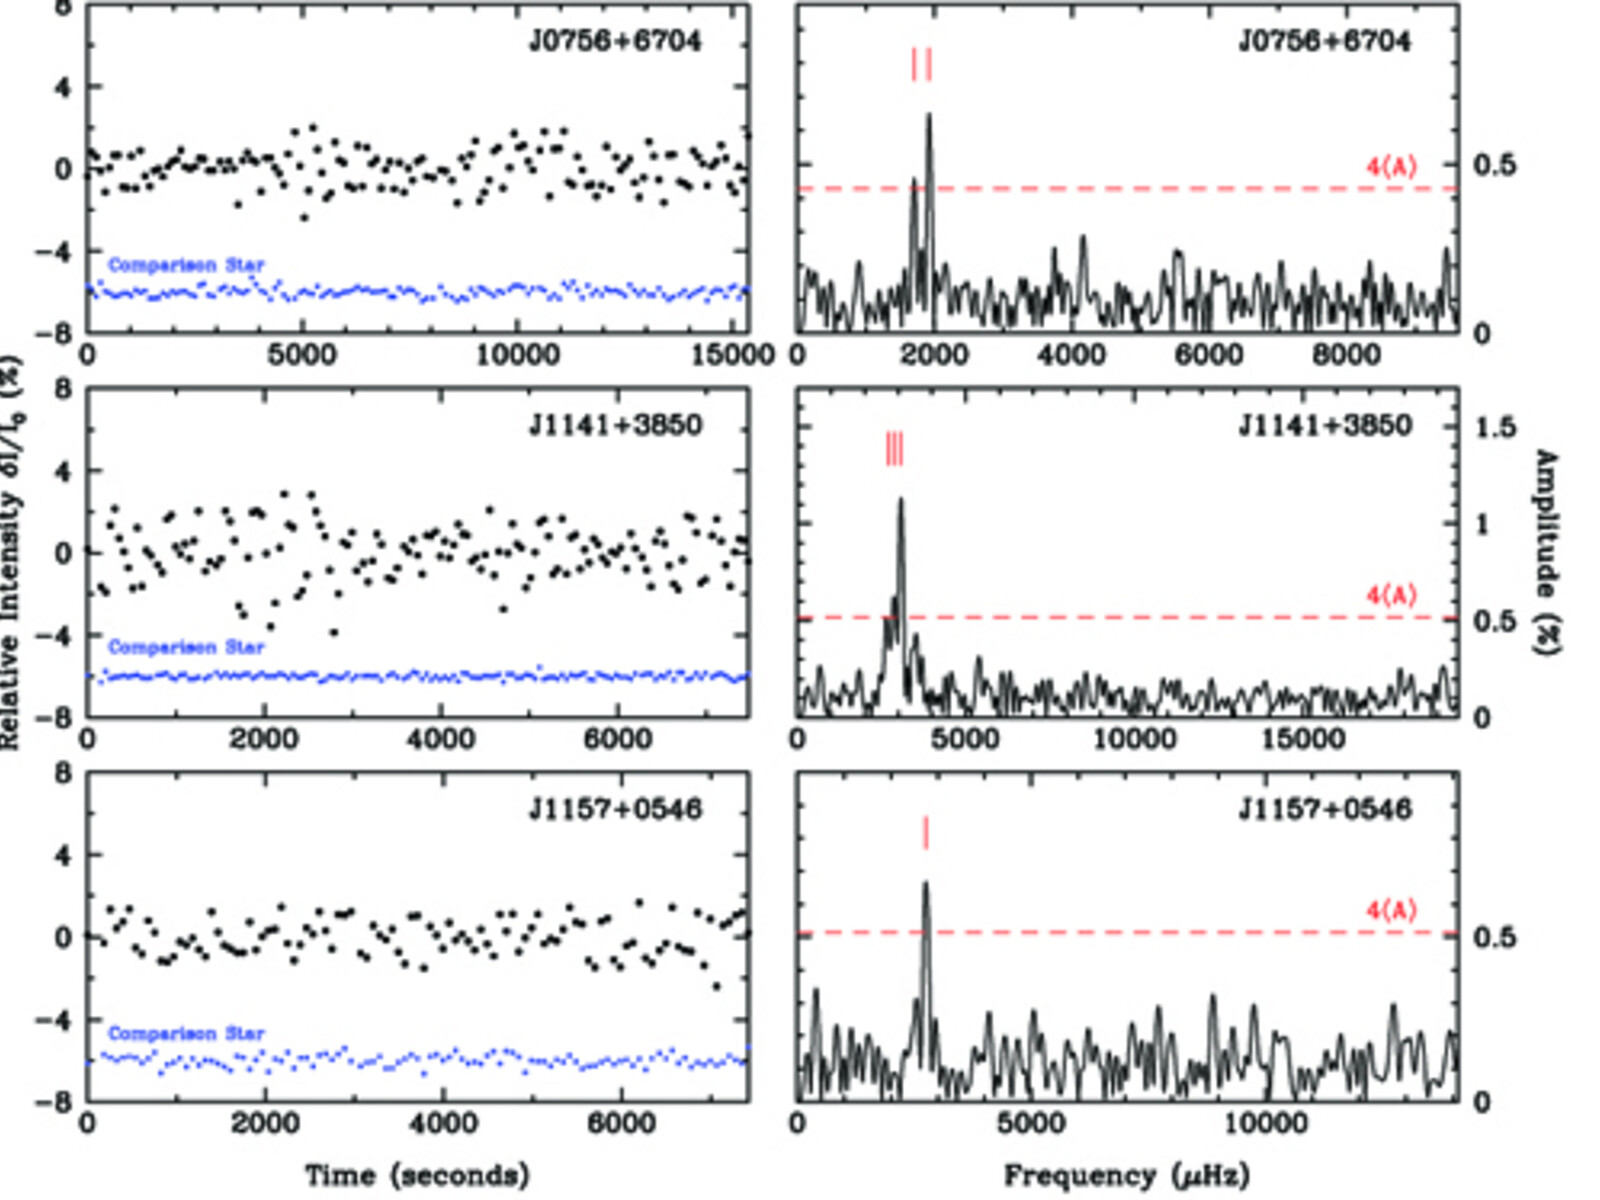
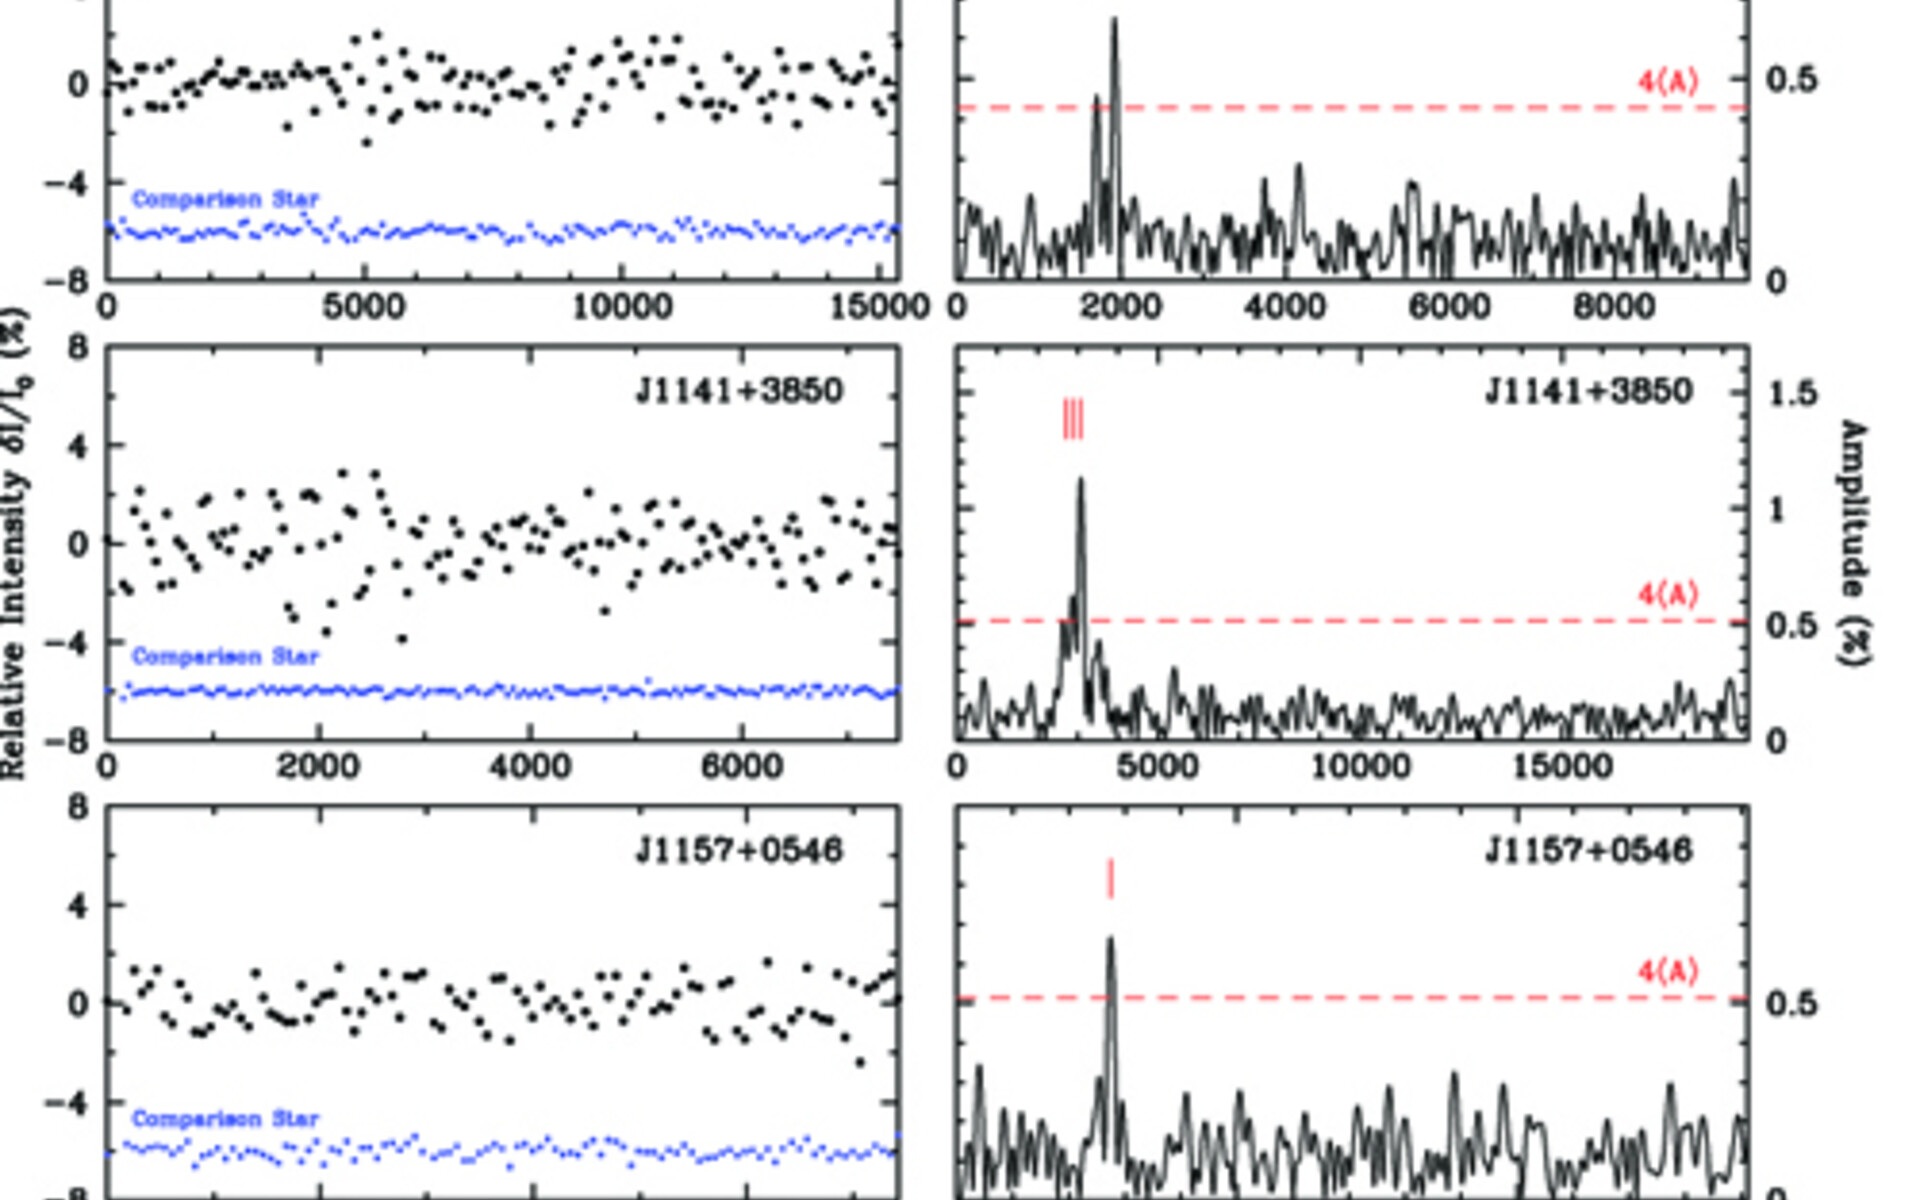
Light curves and Fourier amplitude spectra for the three new pulsating low-mass white dwarfs
Light curves (left) and Fourier amplitude spectra (right) for the three new pulsating low-mass white dwarfs. The red tick marks denote the significant frequencies which lie above the detection threshold of four times the average noise level.