Announcements
We present here measured sensitivity and throughput of GRACES in its experimental phase (phase I). No scientific data were obtained until GRACES was improved, and delivered to Gemini for routine operation.
We define sensitivity as the magnitude of an object that would provide a signal-to-noise ratio (S/N) of 1 for an hour of integration time. To calculate the signal-to-noise ratio, we measured the signal (S) from 600sec observations of the spectrophotometric standard star Feige 66. Those observations were obtained under pristine weather conditions, with a photometric sky and seeing close to 0.4 arcsec. The air mass at the time of the observation was 1.13, so the resulting spectrum was corrected to an air mass of 1.0 using extinction values (magnitude per air mass) from Béland (1988). The spectrum was also binned into the resolution element, i.e. 1.7 pix and 2.9 pix for the 1 fiber and the 2 fiber mode, respectively, so the final result is presented as a function of resolution element.
We determined the noise level from a subtracted pair of 1200sec frames on sky, observed shortly after the Feige 66 spectrum. Using a spectra region generally free of sky lines and artifacts, the noise (N) is determined by multiplying the average standard deviation in the background counts by the square root of the aperture area used to extract the signal. We then have:
,
where TFeige66 and Tsky are the exposure time of the Feige 66 spectrum and the sky, respectively. To find the sensitivity, the signal-to-noise ratio (S/N1hr) is converted to a magnitude and added to the Feige 66 spectrum calibrated in magnitude (MFeige66) available from Massey et al. (1998, ApJ, 328, 31):
.
Here is the resulting GRACES sensitivity for both modes:
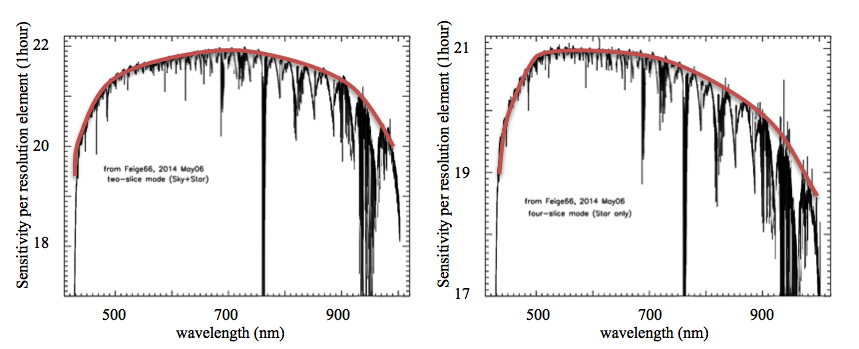
GRACES can deliver a S/N of 1 in 1 hour for a target as faint as 21.9 mag in the 2 fiber mode. Note that this result would be different if GRACES were used under poorer weather conditions. Sensitivity does not depend much on the seeing up to ~IQ85 due to the 1.2arcsec diameter of the fiber. However, the sensitivity would be less for non-photometric conditions, due to increased source extinction resulting in a value of 21.6 mag under CC70%, 20.9 mag under CC80% and brighter than 19.9 mag under CCany (see extinctions for the different cloud cover percentile at http://www.gemini.edu/node/10781#SkyTransparencyClouds).
We determined system throughput based on the same Feige 66 observations that were used for sensitivity. We compared the measured flux with that from a standard Feige 66 spectrum calibrated to the flux of photons hitting the primary mirror. This standard spectrum comes from Hubble space telescope observations (SFeige66) available in the literature (Oke 1990, AJ, 99, 1621) to which we apply a coefficient to correct for the atmosphere extinction. In summary:
,
where
,
where μ is the air mass and Aλ is the extinction coefficient from Béland (1988).
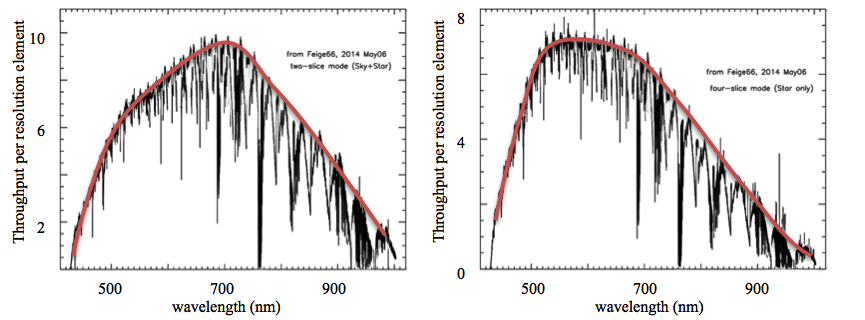
Our results show that 8-10% of the photons with wavelength between 600-800 nm that hit the Gemini North mirror get to the ESPaDOnS detector in the 2 fiber mode. In the 1 fiber mode, the same amount of light gets to the detector, but since the resolution element is smaller, we get values of 6-7% between 500 and 740 nm.
We can translate these results into the S/N one should expect for their observation. To give an idea of GRACES performance in both spectroscopic mode, here is the S/N reached for a flat spectrum of different magnitudes after a 1 hour exposure in the 2 fiber (left) and the 1 fiber (right) modes: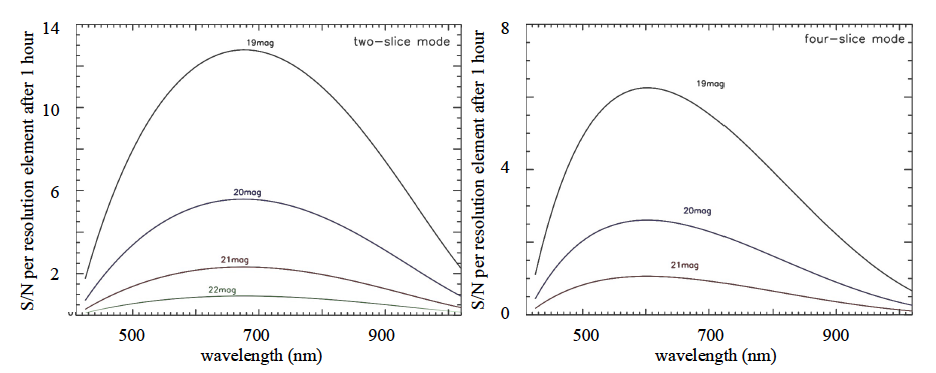
These results can be compared with the performance of other high-resolution spectrographs on 8-10m telescopes. Here is the S/N obtained after a 1 hour observation of the star Feige 66 with GRACES (2 fiber mode, in black), HIRES (in green) and UVES (in blue):
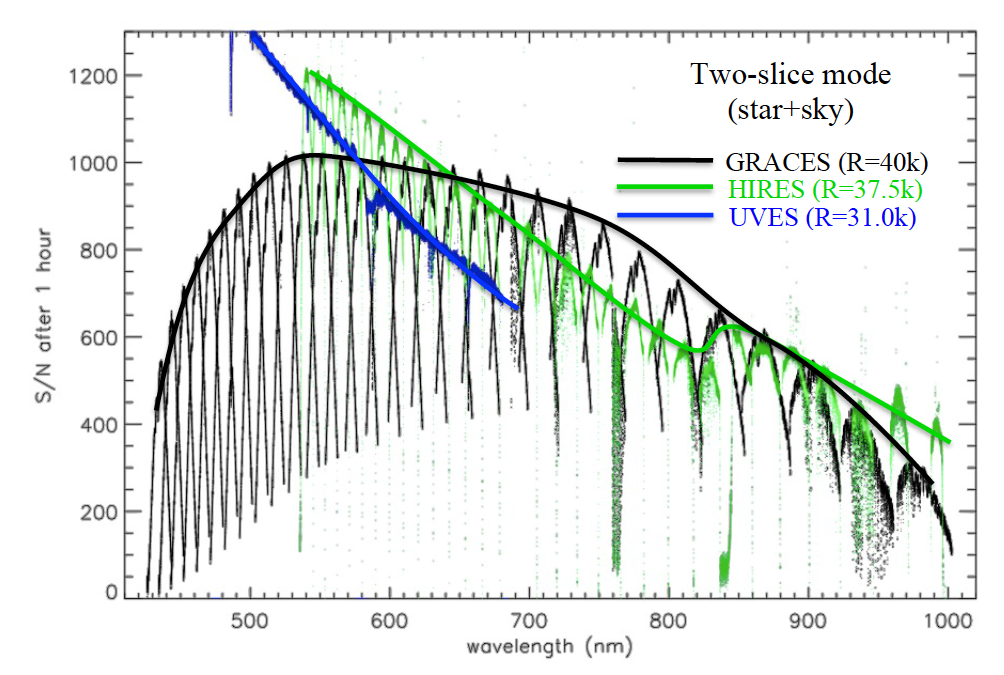
One can see that all spectra are comparable. The HIRES and UVES spectra were modified to correspond to the GRACES resolution and the weather conditions when the GRACES spectrum was observed. More details about this comparison can be provided by the instrument team upon request.
You may be interested also to read about the effect of Atmospheric Differential refraction (GMOS page).