Announcements
Sensitivity and Overheads
For sensitivities of ALTAIR use the GNIRS, NIRI, or NIFS Integration Time Calculators. However, please see here for some restrictions regarding use of the ITC, including use at L'.
The additional observing overhead due to Altair in both NGS and LGS modes has been measured to be about 5 minutes except for NIFS + LGS which takes an additional 8 minutes. These estimates come from the Observatory Statistics webpage. The overhead is generally small because if the coordinates are accurate, the guide star generally falls within or very close to the WFS field stop, and the loop can be closed in a few minutes.
The actual overhead time is not easily predictable as it depends on distance from the previous target, the field crowdedness, the faintness of the guide star, the accuracy of the guide star magnitude and the detail of the finder chart. Once the guide star is acquired, everything behaves as in regular operation with GNIRS, NIFS, or NIRI, and the overhead associated with those instruments applies (see the GNIRS, NIFS, and NIRI overheads sections).
Corrected Image Quality
Introduction
The delivered Strehl ratio (the ratio of the delivered peak intensity to the theoretical peak intensity) is dependent on many factors, such as the natural seeing and stability of the atmosphere, the wavelength of the observations, the brightness of the guide star, the separation between the science target and the guide star, and of course the performance of the telescope and adaptive optics system. In general the Strehl ratio in NGS mode will be better than in LGS mode, and the Strehl ratio in LGS mode will be better than in "LGS + P1" mode, but please see the relevant sections for more information.
Bright Star PSFs
We have assembled an Altair image library based on real observations of bright stars in a variety of seeing conditions and NIRI instrument filters. These are all actual images from Altair science programs. Please note that actual performance could very well vary from the image library, potentially being better or worse depending on environmental and instrumental conditions. However, generally performance achieved should be similar to the image library. For PIs requiring very strict delivered image quality criteria, it is suggested that a delivered image quality criteria be clearly stated in the science proposal and, if approved, communicated to the Contact Scientist at the Phase II level to create a delivered image quality criteria.
PSF Stars
When observing a resolved target without nearby point sources it may be desirable to observe a known point source to determine the point spread function (PSF) of the telescope + AO + instrument + atmosphere. Due to the time variability of the atmosphere and the difficulty of matching the observing parameters, it is impossible to know the exact PSF in a field where there are no point sources. That said, it is possible to estimate the PSF by observing a point source (a "PSF star") before and/or after a science observation.
A PSF star should:
- Be relatively close on the sky, ideally less than 5 degrees away
- Have a guide star which is about the same brightness as the one used for science (|dm|<0.5 mag)
- Be at a similar distance from the guide star as is the science (|dr|<3")
- Have a guide star which is at a similar position angle as is used for the science observation (|dPA|<20 deg)
- Be relatively bright to minimize the overhead of the additional observation
ITC Strehl Relations
The Integration Time Calculators (ITCs) estimate the Strehl which may be expected for a given observation. While these are only limited estimates, we have plotted the ITC relations below as a guide to help understand how the Strehl should vary with different observation parameters.
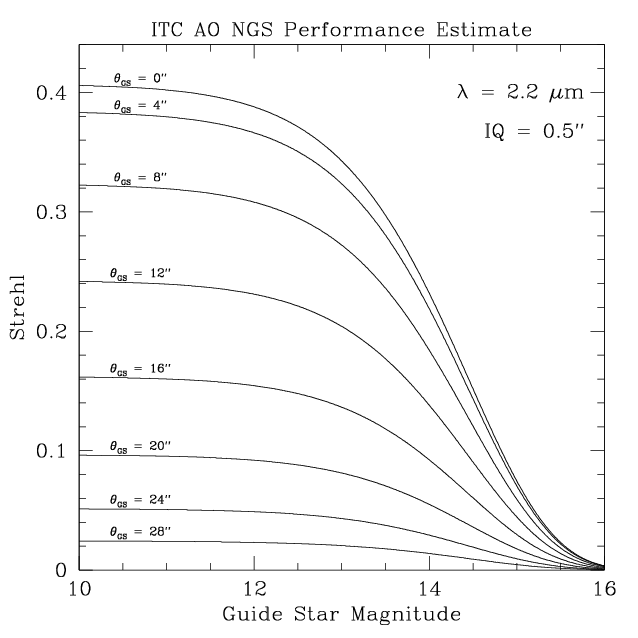
Strehl as a function of guide star magnitude plotted for different guide star separations ranging from 0 to 28 arcseconds.
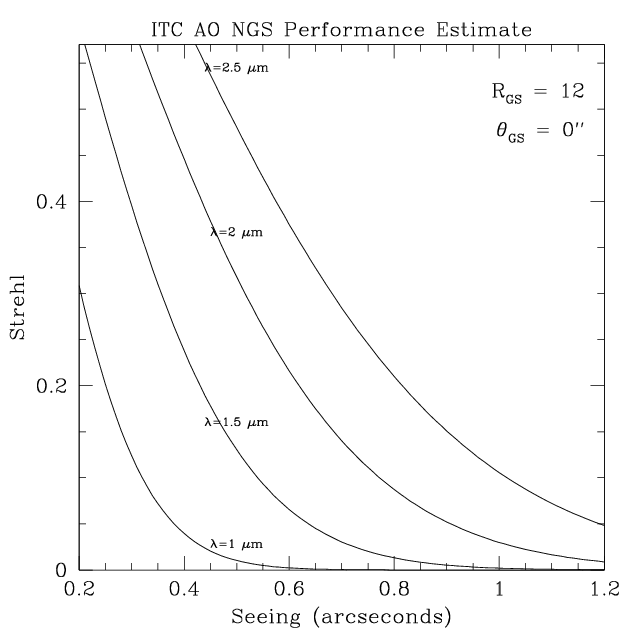
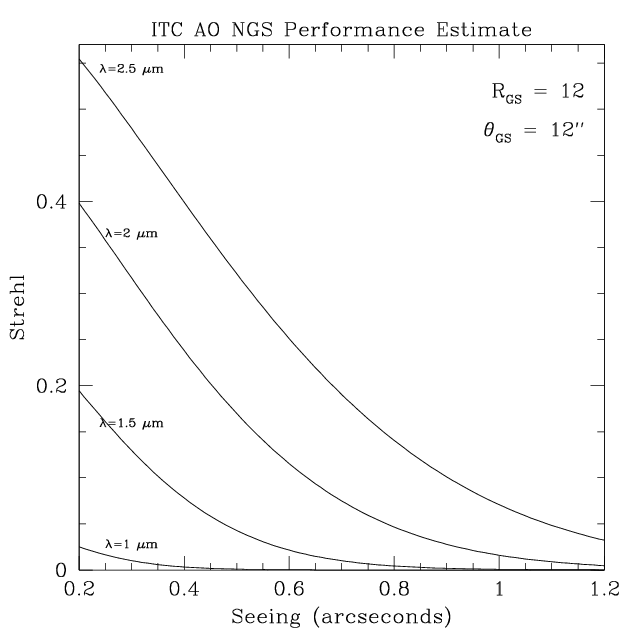
Strehl as a function of natural seeing plotted for different wavelengths ranging from 1 to 2.5 microns with the guide star on-axis (left) and 12 arcseconds off-axis (right).
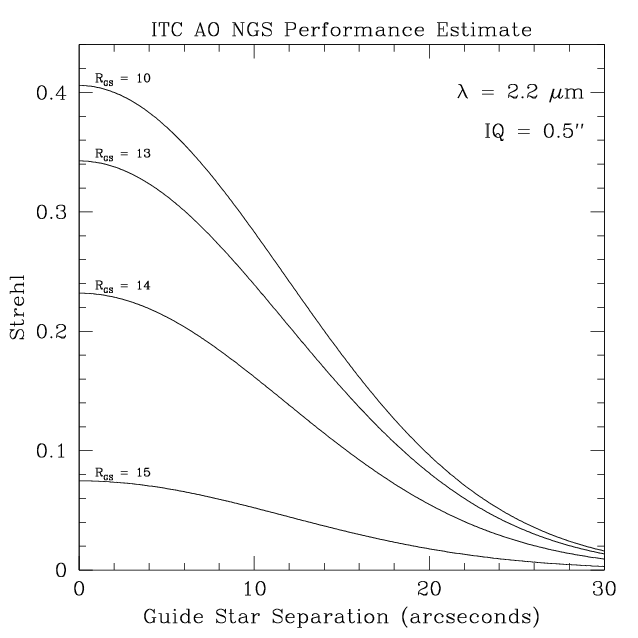
Strehl as a function of guide star distance plotted for different guide star magnitudes ranging from 10 - 15.
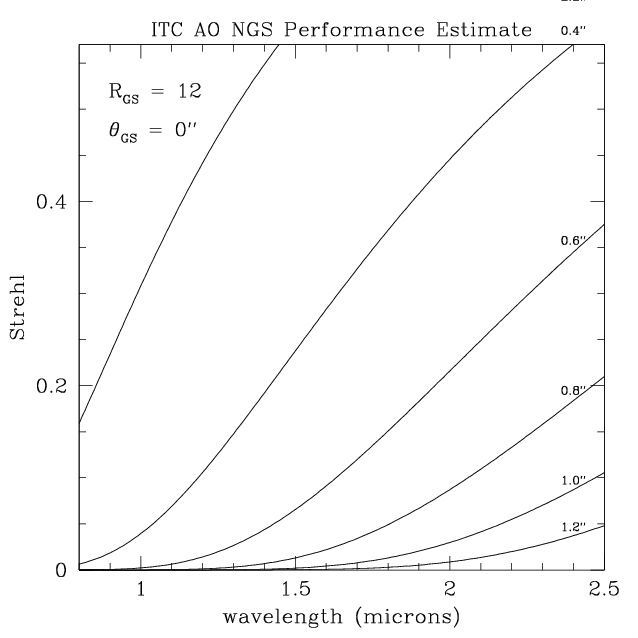
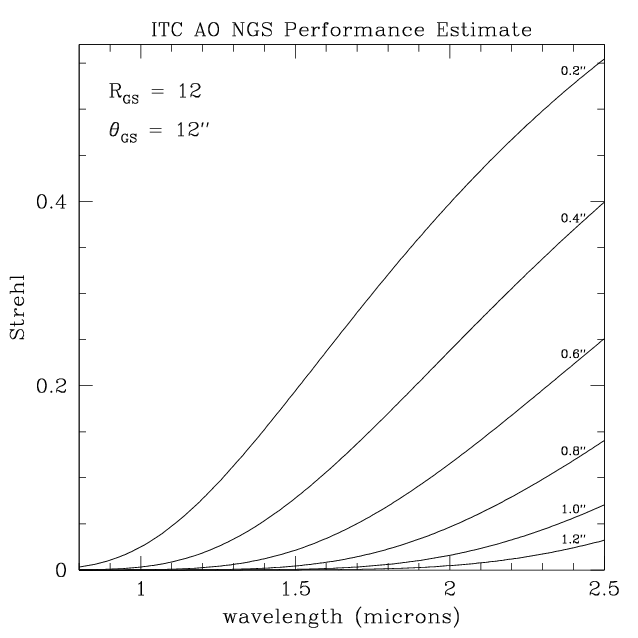
Strehl as a function of wavelength plotted for different values of the natural seeing ranging from 0.2 to 1.2 arcseconds with the guide star on-axis (left) and 12 arcseconds off-axis (right).
Image Library
(Examples of NGS - AO - NIRI Setups)
NIRI instrument details here
ALTAIR instrument details here
| Filter | IQ | Seeing [arcsec] |
Strehl | FWHM [arcsec] |
Air Mass | Image Example |
| K-prime | 20% | 0.361 | 0.30 | 0.070 | 1.075 | N20091029S0106.fits |
| K-prime | 70% | 0.553 | 0.17 | 0.096 | 1.217 | N20081209S0200.fits |
| K-prime | 70% | 0.670 | 0.16 | 0.082 | 1.253 | N20091125S0178.fits |
| K-prime | 85% | 1.046 | 0.08 | 0.089 | 1.094 | N20091120S0110.fits |
| K-continuum | 20% | 0.327 | 0.27 | 0.085 | 1.018 | N20091024S0190.fits |
| H | 20% | 0.359 | 0.13 | 0.065 | 1.073 | N20091029S0108.fits |
| H-continuum | 20% | 0.317 | 0.20 | 0.065 | 1.193 | N20080907S0025.fits |
| J | 20% | 0.412 | 0.04 | 0.074 | 1.126 | N20090513S0378.fits |
| J-continuum | 20% | 0.358 | 0.03 | 0.096 | 1.063 | N20091024S0156.fits |
K-prime Filter |
IQ-20% |
|
 |
 |
 |
| N20091029S0106.fits | Strehl: 0.30 Delivered Seeing: 0.361" FWHM: 0.070" Air Mass: 1.075 | |
K-prime Filter |
IQ-70% |
|
 |
 |
 |
| N20081209S0200.fits | Strehl: 0.17 Delivered Seeing: 0.553" FWHM: 0.096" Air Mass: 1.217 | |
K-prime Filter |
IQ-70% |
|
 |
 |
 |
| N20091125S0178.fits | Strehl: 0.16 Delivered Seeing: 0.670" FWHM: 0.082" Air Mass: 1.253 | |
K-prime Filter |
IQ-85% |
|
 |
 |
 |
| N20091120S0110.fits | Strehl: 0.08 Delivered Seeing: 1.046" FWHM: 0.089" Air Mass: 1.094 | |
K-continuum Filter |
IQ-20% |
|
 |
 |
 |
| N20091024S0190.fits | Strehl: 0.27 Delivered Seeing: 0.327" FWHM: 0.085" Air Mass: 1.018 | |
H Filter |
IQ-20% |
|
 |
 |
 |
| N20091029S0108.fits | Strehl: 0.13 Delivered Seeing: 0.359" FWHM: 0.065" Air Mass: 1.073 | |
H-continuum Filter |
IQ-20% |
|
 |
 |
 |
| N20080907S0025.fits | Strehl: 0.20 Delivered Seeing: 0.317" FWHM: 0.065" Air Mass: 1.193 | |
J Filter |
IQ-20% |
|
 |
 |
|
| N20090513S0378.fits | Strehl: 0.04 Delivered Seeing: 0.412" FWHM: 0.074" Air Mass: 1.126 | |
J-continuum Filter |
IQ-20% |
|
 |
 |
 |
| N20091024S0156.fits | Strehl: 0.03 Delivered Seeing: 0.358" FWHM: 0.096" Air Mass: 1.063 | |
