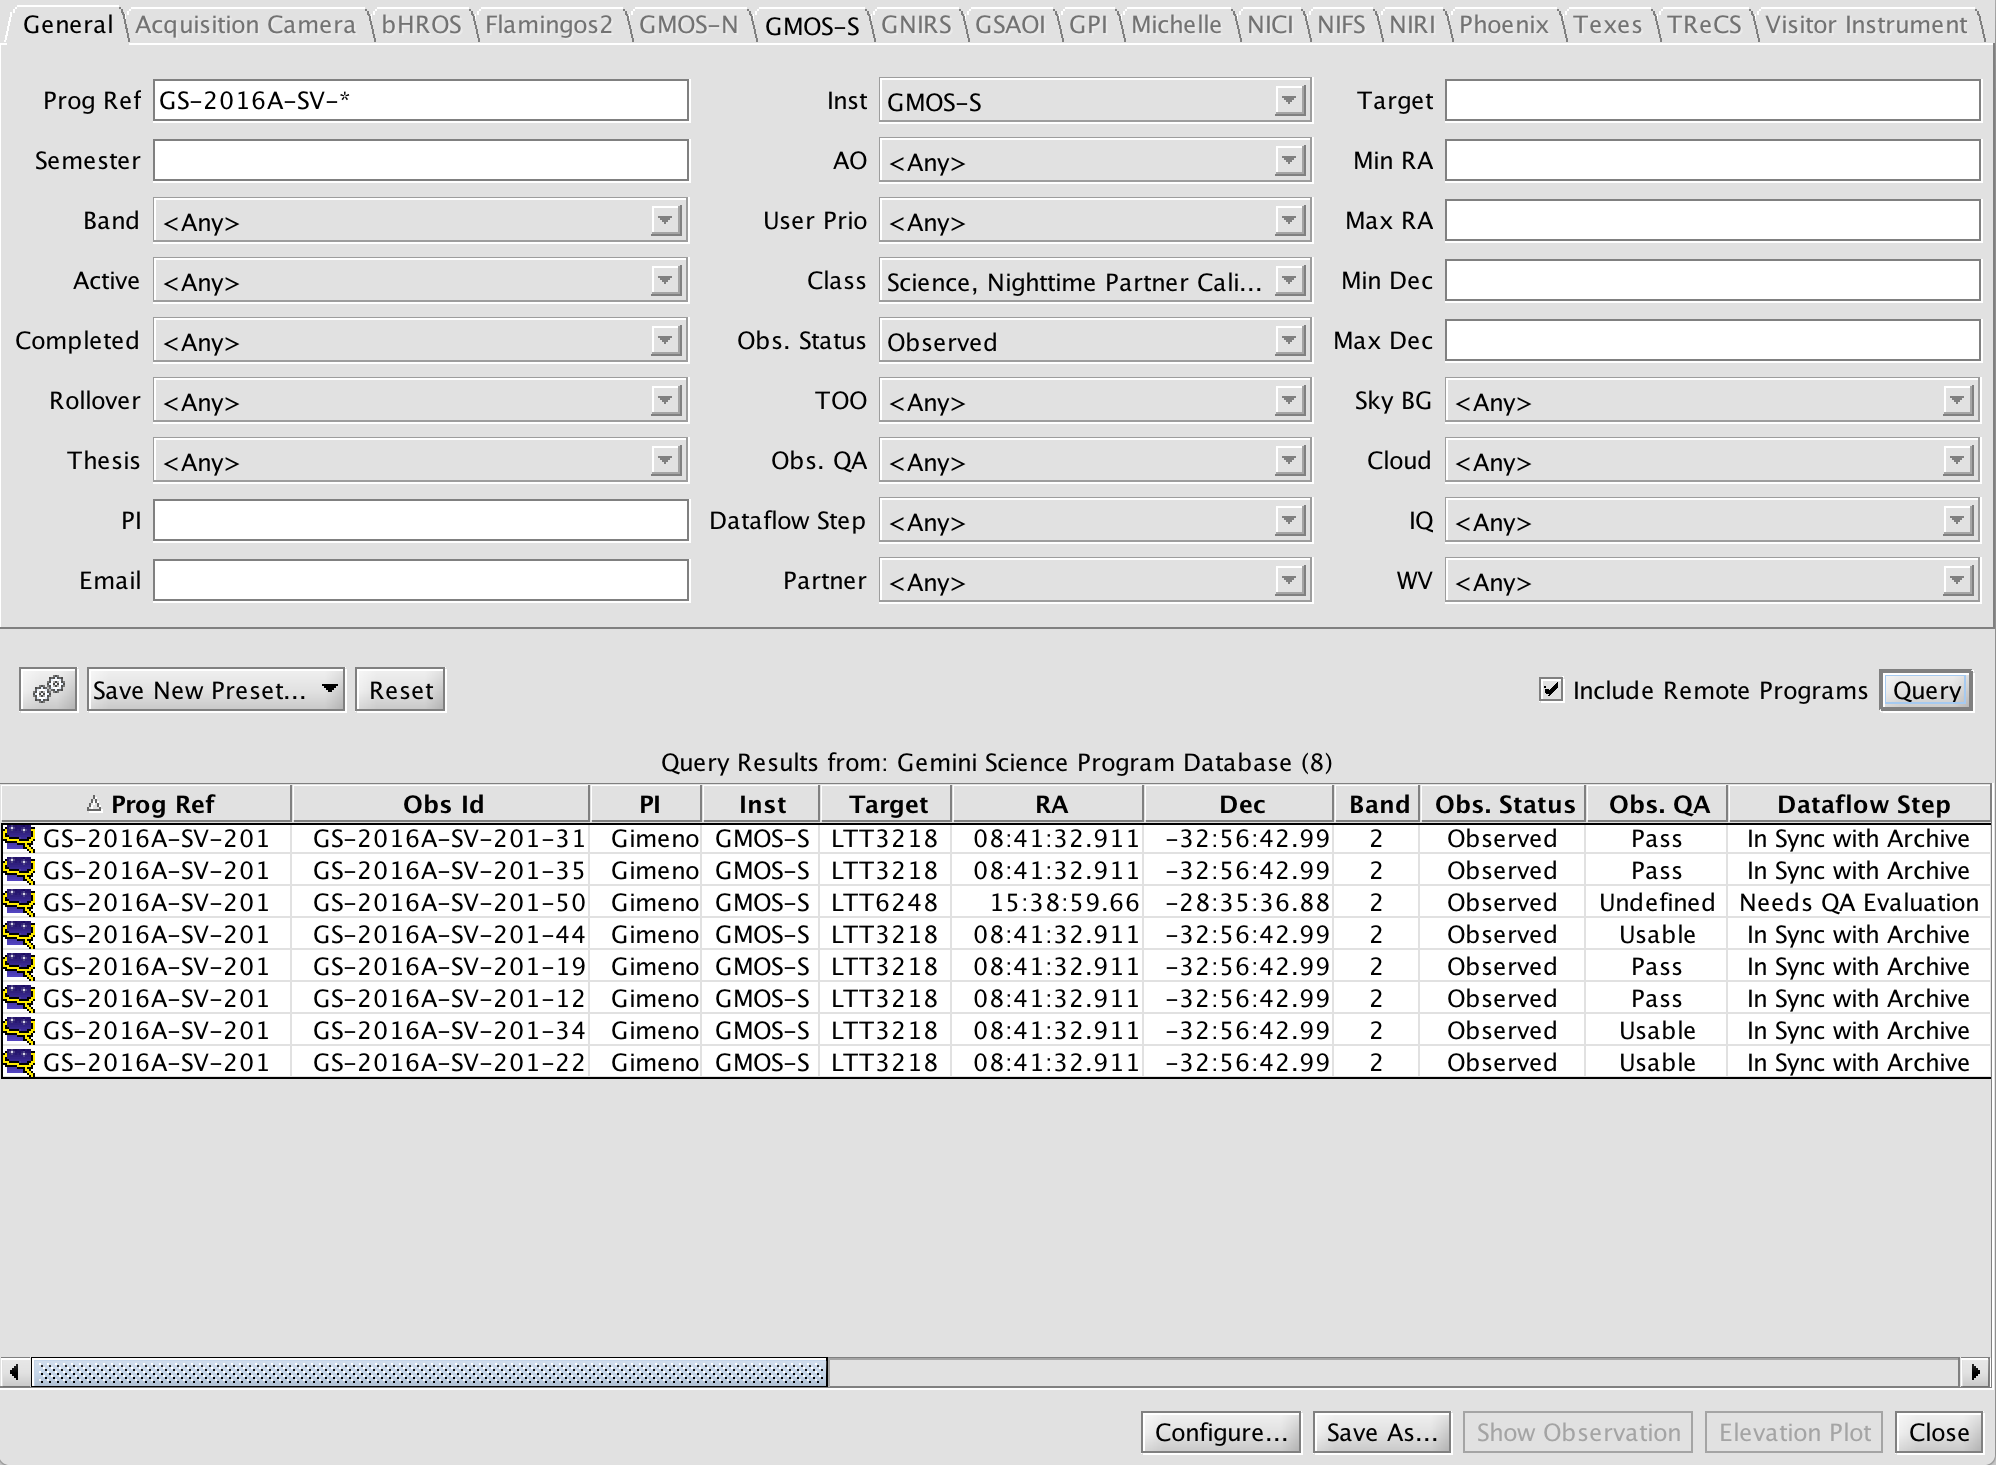
The OT Browser provides a simple way to search for observations in the programs that are accessible with the currently active key. The Browser is accessed by clicking the OT Browser... button on the welcome screen or by selecting OT Browser... from the File menu in the Science Program Editor. The main browser screen provides controls for the main search parameters and options for displaying the results.

The query constraints are set in the upper section. Wildcards (*,?) can be used in the text boxes. Pull down menus give lists of other options. Click Reset to clear all constraints and start with default values. If the Include Remote Programs checkbox is checked, then the query will be run on programs in the remote Observing Database (ODB) as well as on local programs. Uncheck this box to just search local programs. Then click Query to start the query.
Only regular observations, not those in the special Templates folders, are searched. Also, only the information in the static (top-level) instrument components can be searched, so configuration changes in instrument iterators in sequences will be missed.
If any instruments are selected in the Inst menu in the General tab, then the tabs for those instruments are activated. Selecting one then allows additional instrument configuration constraints to be selected (see the example below).

You may save the current set of query parameters by selecting Save New Preset... and then providing a short name. This option will then be available in the menu to the right of the gears preferences button.
The results are displayed in the lower section of the Browser window. Observations in local programs are shown with a black font, observations in programs in the ODB are shown with a grey font.
You can configure the columns that are shown in the results table by clicking the Configure... button at the bottom.
The Save As... button allows you to save the query results to a Skycat-format ASCII file. A dialog will appear where you can selected the directory and give the file name.
Double-clicking on a row in the table or selecting a row in the table and clicking Show Observation will open the program in a Science Program Editor at the position of the observation. If a program is in the ODB then it will be downloaded and displayed.
Highlighting rows in the table and then clicking Elevation Plot will display the elevation vs. time graph for the selected observations.